 Facebook
  Twitter
  Soundcloud
  Youtube
  Rss
Rss 
All eyes have been fixed on the DPR this week, but to get a handle on what’s going on with bills like MD3, we need to understand other trends shaping the DPR.
It is important not to forget the implications of the parliamentary (DPR) elections held in April this year and what they might mean for the effectiveness of government after the new president takes the oath in October. With even a cursory look at the party make-up of the new house following the April elections, it is hard to escape the conclusion that this was a terrible result.
The new DPR is an even more fragmented chamber than the previous one, with a greater number of parties elbowing for power and pork (or perhaps more appropriately, daging sapi). There is no clear winner who might be able to set the agenda and provide overall leadership in the legislative branch of government.
Such leadership is very important in Indonesia’s “separation of powers” presidential system, more so than in a Westminster system such as Australia’s where the Prime Minister also leads in parliament, with the Speaker’s role largely subordinated to executive government.
With each successive election since 1999 the DPR has become more politically diffuse and, with its internal procedures dominated by consensus decision-making, there is an ever increasing number of veto-players who create deadlock the system and use the system to extract partisan benefit and corrupt favours.
It makes disturbing viewing to place the April 2014 election results in the context of the growing fragmentation of parliamentary politics since the first post-Suharto elections in 1999. The DPR elected in 1999 had five major parties while, following the 2004 election, the number of major parties that took up their seats increased to seven. The number increased to nine after the 2009 election and has increased again to ten in the chamber elected in April this year. Moreover, while there was one clearly dominant party in the 1999 DPR – PDIP, with 33 percent of the seats – there has been a strong downward in the size of the leading party since, with PDIP forming the largest caucus in the new 2014 DPR while holding just 19.5 percent of the seats in the newly elected chamber.
Figure 1 below shows the composition of the DPR elected in 1999.
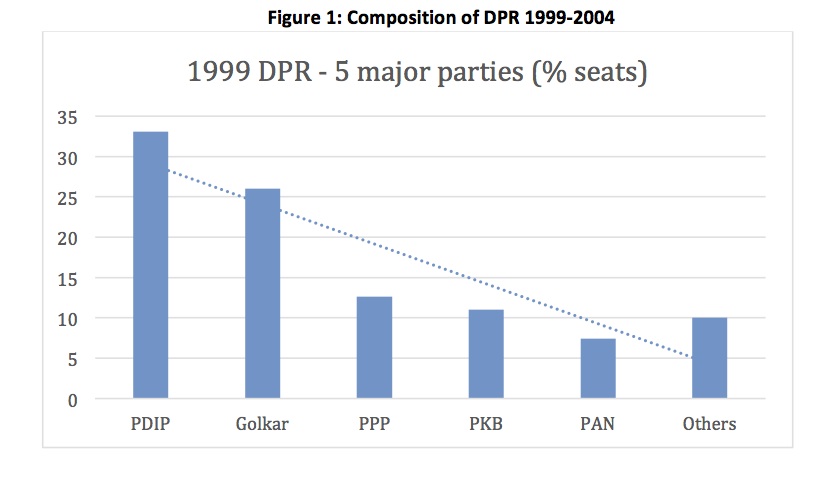
Although there was a common perception at the time that the DPR was composed of an excessively large number of parties following the freeing up of the political system in 1998, in fact there were only five parties that really counted: PDIP, Golkar, PPP, PKB and PAN.
The chamber was numerically dominated by PDIP, with a third of the seats. The second largest party, Golkar, held about a quarter of the seats and these two largest parties together formed a clear majority of the elected seats (59%). PDIP held almost as many seats as all the other non-Golkar parties put together. Three middle-sized parties (PPP, PKB and PAN) together made up almost one third of the DPR, while the rest was held by 15 small parties, 10 of which held just one seat each.
Although there were two dominant parties in the 1999 legislature occupying a majority of seats, this DPR established the key feature that has characterised all successive parliaments – no party has formed a majority and the electorate’s support has been dispersed across an ever increasing number of parties.
Figure 2 below shows the trend towards increasing fragmentation that began in the 2004 election.
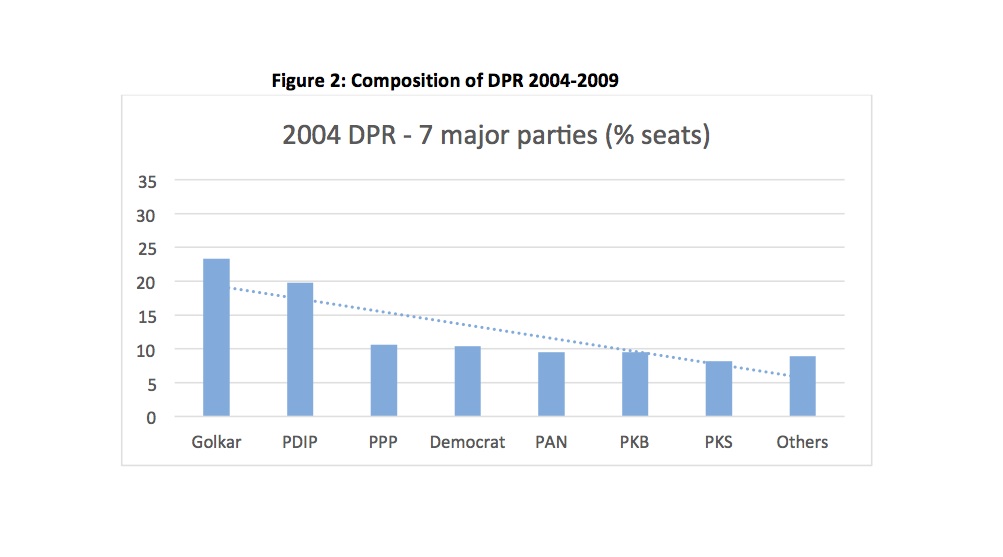
A large number of voters deserted PDIP (the party retaining less than 20 percent of seats) but these voters did not appear to move uniformly behind one other party but scattered their support.
In particular, Golkar failed to pick up the PDIP vote and, despite emerging as the largest single parliamentary caucus, its relative strength decreased from 26% of seats in 1999 to 23% of seats in 2004.
Thus the two largest parties were together well short of a majority. Almost half of the seats were held by five middle sized parties with about 8-10% each: PPP, Democrat, PKB, PKS and PAN. The relative distance between the strengths of the large and middle-sized parties was much smaller than in the first DPR. Whereas the 1999 DPR was said to be dominated by the “big five” parties (of which PDIP was by far the largest), the 2004 chamber was controlled by a “big seven” parties: two large parties of similar size and five others of fairly equal size. The two new players were Democrat, formed to back the presidential aspirations of SBY, and PKS, the Islamic party that campaigned very successfully in the 2004 poll and greatly increased its vote from its predecessor party in 1999 (Partai Keadilan).
The fragmentation of the DPR continued further after the 2009 election, as shown in Figure 3 below.

The new threshold requiring that parties exceed 2.5 percent of the vote to gain DPR representation eliminated all the very small parties, but the number of major parties increased once again, this time to nine.
The major movement of voter support to Democrat that followed from the popularity of SBY after his first term as President put the party at the front of the pack, joining Golkar and PDIP as the leading forces. In addition, there were now two other new parties formed by presidential aspirants, Hanura and Gerindra, leaving a parliament with three larger parties (Democrat, Golkar and PDIP) holding just over sixty percent of the seats and six smaller parties holding the rest (PKS, PAN, PPP, PKB, Gerindra and Hanura).
The 2014 elections have once again continued the trend of votes scattering across an increasing range of parties, as shown in Figure 4 below.
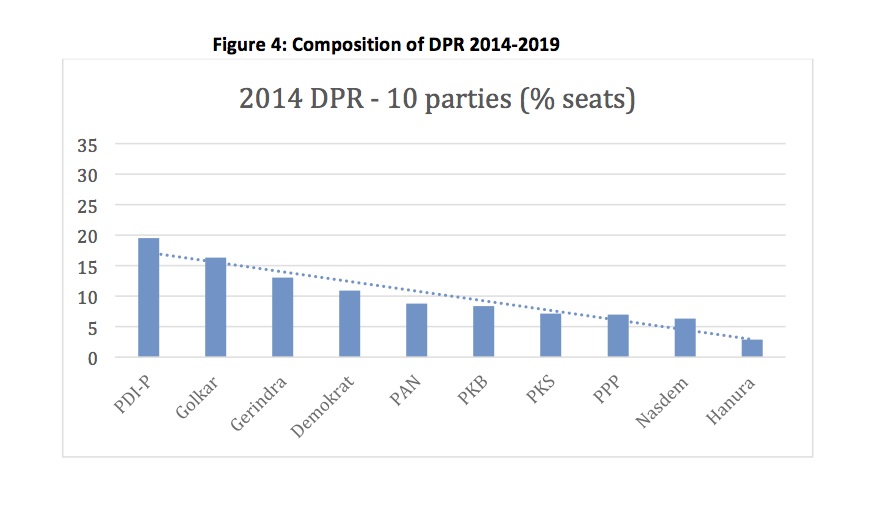
On this occasion the appearance of yet another party formed as a vehicle for a presidential aspirant – National Democrat (Nasdem) – increased the number of parties to ten.
PDIP regained its former position as the leading party (19.5 percent of seats), closely followed by Golkar (16.3 percent of votes), maintaining at least one aspect of continuity with the prominent position of these two parties. The Democrat presence collapsed to fourth place from 26.4 percent of seats to 10.9 percent, as SBY’s term came to an end and the party could produce no viable replacement.
A remarkable feature was growth of Gerindra in the wake of Subianto Prabowo’s presidential candidacy, from 4.6 to 13 percent of seats, moving from the second smallest party in parliament and overtaking Democrat to become the third largest party.
The most striking effect of the 2014 result can be seen in Figure 4 above where the two trends of greater numbers of parties and relative weaker results for the leading parties have combined to produce a DPR with a very flat profile.
Over the four elections the profiles have become gradually less steep as the difference in size between the larger and the smaller parties has become progressively less. The previous pattern of two or three parties occupying most of the seats has been eroded and the number of smaller parties holding the remainder has increased.
Figure 5 below shows the downward trend in the size of the largest party in the DPR since 1999. In 1999 PDIP was far ahead of all other parties with 33 percent of the seats, seven percentage points ahead of the next party, Golkar. Golkar won the leading position in 2004, but in a much weaker position, with just 23 percent of the seats, a mere three percent ahead of PDIP. In 2009, Democrat’s relatively strong showing gave it 26 percent of the seats, seven percent ahead of Golkar. But in 2014, PDIP’s leading position with 19 percent of the seats is at an historic low for the party in the so-called “winning” position and is just 3 percent ahead of party number two, Golkar.

The same trend can be seen in Figure 6 below regarding the two largest parties. While in 1999 the two major parties (PDIP and Golkar) took almost 60 percent of the seats, since that time the average combined size of the two largest parties has been around 40 percent, reaching a low of 36 percent in 2014.
While the parliaments of 1999 and 2004 had two clear leaders, with the rest of the vote divided roughly equally amongst the rest, the 2009 DPR was characterised by three parties in a relatively stronger position (Democrat, Golkar and PDIP), a significant drop to the fourth party (PKS), with a gradual tapering off of support for the rest.
In the case of the 2014 DPR, however, there is no obviously dominant party and the two or three biggest parties have only about 3 percentage points difference between them and the smaller parties are close behind.

Figure 7 below shows the combined vote of the three largest parties since 1999.
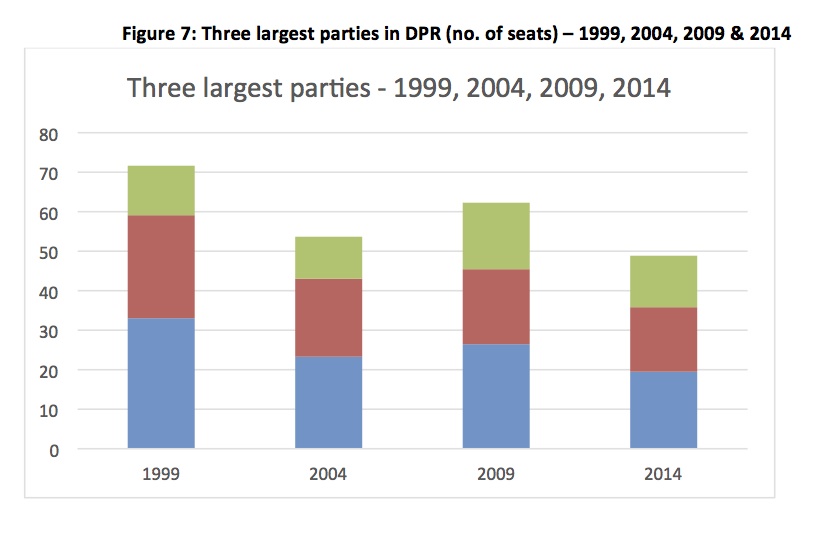
In 1999 there were three parties that occupied more than 70 percent of the chamber. In the two subsequent elections, the three top parties managed to constitute of majority of the house, but in the DPR elected in 2014, the three main parties together hold less than 50 percent of the seats: four or more of the ten parties would have to combine forces to reach a majority if a vote was taken on any question before the house.
In the second part to this series tomorrow we’ll explore some ideas about why this fragmentation might be occurring. (yep, it’s the parties).
Stephen Sherlock is a consultant on governance and politics and Visiting Fellow in the Dept of Political and Social Change at ANU.