 Facebook
  Twitter
  Soundcloud
  Youtube
  Rss
Rss Here is another graph that may get some interesting discussion going. Like yesterday’s graph, it is taken from the National Statistics Office of Thailand’s 2007 Household Socioeconomic Survey (Table 4).
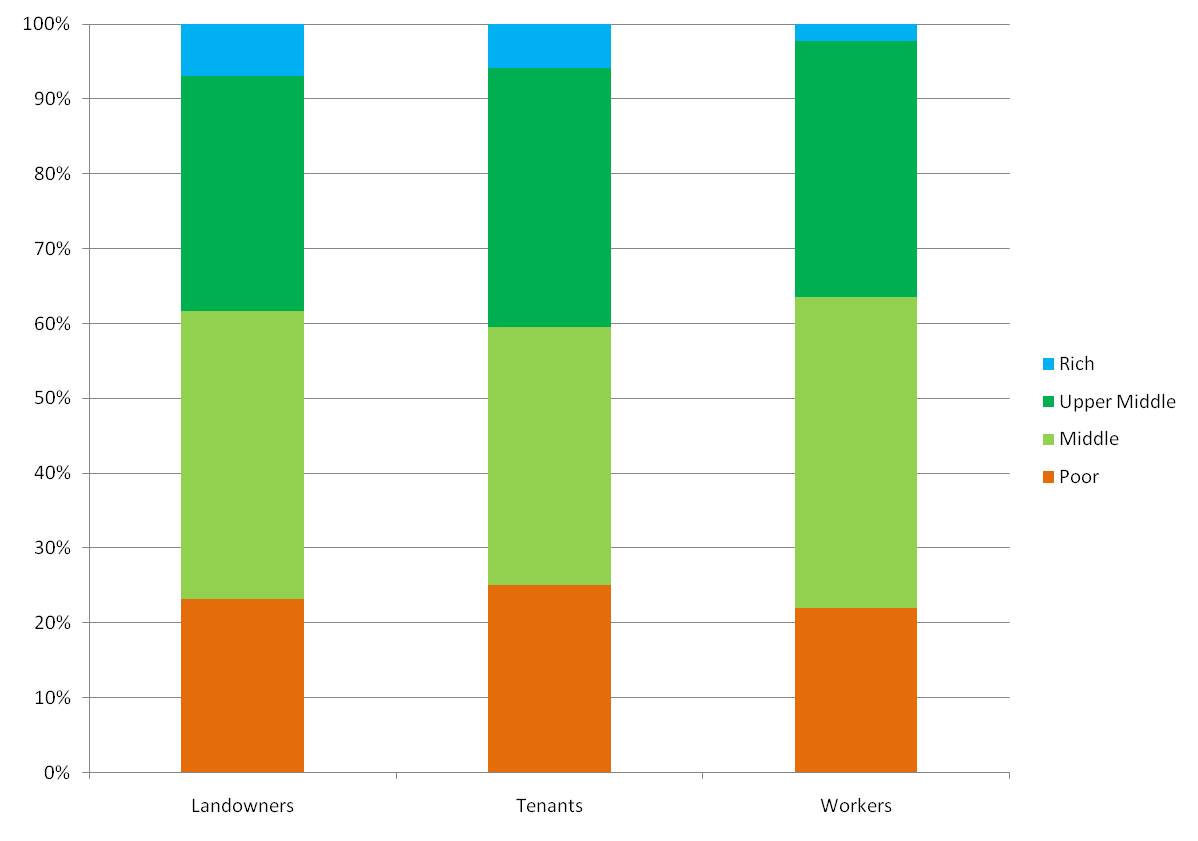
It shows, for (1) landowning farmers; (2) tenant farmers and (3) agricultural workers, the percentage of households in four different income categories. The income categories are my aggregations of the NSOs income bands. I’m not completely happy with the categories, but they are the best I could do with the data provided.
- Poor: household income of less than 60,000 baht per year.
- Middle: household income of 60,000 to 120,000 per year.
- Upper-middle: household income of 120,000 to 360,000 per year.
- Rich: household income of more than 360,000 per year.
These data give a nice illustration of the importance of what I like to call the “middle-income peasantry” (light green and dark green segments). Popular images of rural people in Thailand as impoverished peasants living under the yoke of landlords, money lenders and middlemen, are no longer particularly useful for understanding contemporary politics.
In relation to some of the comments to yesterday’s post: yes, these middle income farmers (especially the landowners) do borrow a lot for household expenses (motorbikes, televisions, mobile phones etc). This is a very good indicator of their middle-income status. They are moving on in the world and, like many of us, are using credit to do it. I don’t accept that a large number of them are on the brink of foreclosure. Of course this happens sometimes, but in my experience it is relatively uncommon. (Does anyone have any good data on foreclosure?) If my household debt was only 70% of my annual household income I would be a happy man!