 Facebook
  Twitter
  Soundcloud
  Youtube
  Rss
Rss 
For months now, Indonesia’s pollsters have been in agreement: the status quo in both the executive and legislative branches will hardly change after Wednesday’s election. Since the beginning of intensive polling early this year, President Joko Widodo (Jokowi) has held a large and substantial lead over Prabowo Subianto. In the legislative race, all but one of the incumbent parties appears set to return, with only moderate changes to their relative strength.
But can the polls be believed? My research on pollsters in Indonesia suggests that, for the most part, they have been able to accurately measure support for presidential candidates. Pollsters have also fared well in measuring support for the largest and very smallest parties. They struggle, however, with the technically challenging task of estimating support for the middling Islamic parties that together comprise a large and influential parliamentary bloc. The only likely divergence from polls on election day will be the strong overperformance by most—perhaps even all—Islamic parties.
State of the presidential race
In presidential polling, the level of support for Jokowi has held steady since December 2018. In poll after poll, he receives close to, and usually a bit over, 50% of vote intentions when undecided voters and those who refused to name a preference are included. Prabowo receives between 31– 37% of vote intentions in those same polls. The share of undecideds and refusers continues to fluctuate, in part as a function of how pollsters structure their questionnaires, but their numbers are decreasing. On average, undecideds and refusers now constitute a little over 10% of respondents.
In a country where turnout in presidential races has been close to 75%, the share of poll respondents who have not indicated a preference is now much smaller than the share of the electorate that will not vote. There are no longer enough undecideds and refusers to alter the outcome of the race, in the unlikely scenario in which all of them vote and all of them prefer Prabowo.
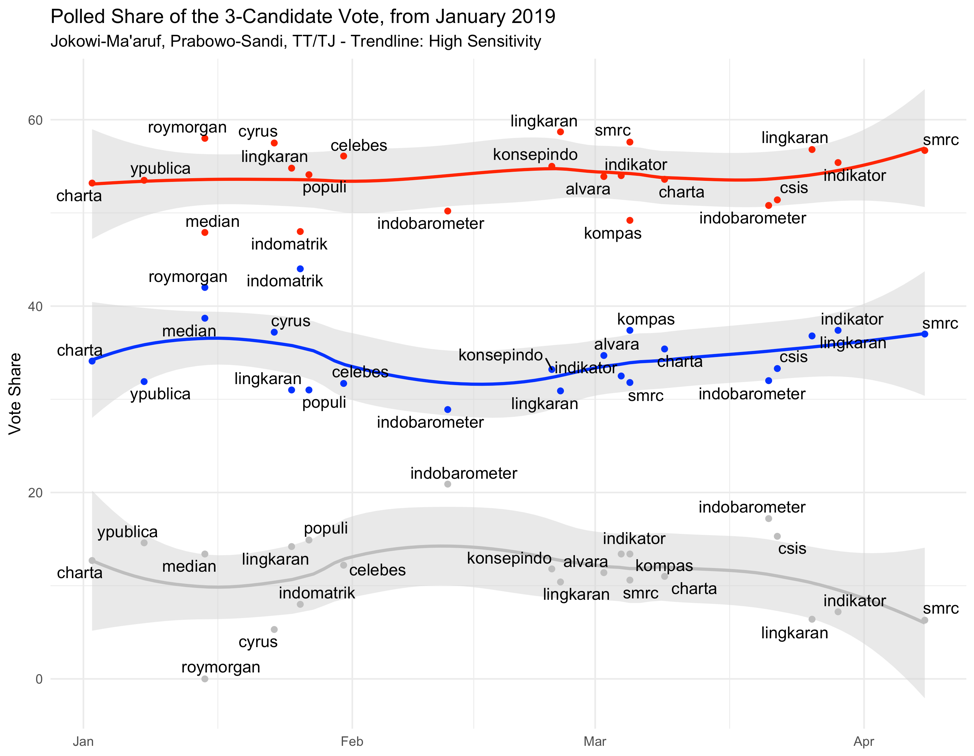
Figure 1: Polls of the presidential race since 1 January 2019. Jokowi in red, Prabowo in blue, and undecided in grey. Polls are identified by name.
If the race turns out to be close, Indonesia’s 2019 presidential election will be the site of one of the largest misses in the history of election polling. None of the warning signs that usually precede such a miss—declining response rates, low expressed certainty from voters about their choice, or nonsensical correlations between presidential and legislative preferences—are occurring in this race. For survey researchers, the open question in the presidential race is not whether Jokowi will win, but whether his margin of victory will exceed 15%.
In 2014, the polls looked very different. While Jokowi led in every credible poll, his lead was narrow. His support on election day exceeded pollsters’ expectations, though the race was nonetheless the closest in the short history of direct presidential elections in Indonesia. For users of polls today, the 2014 polls provide two important lessons. First, that when the race is close, so are the polls. Second, that the current race is not close.
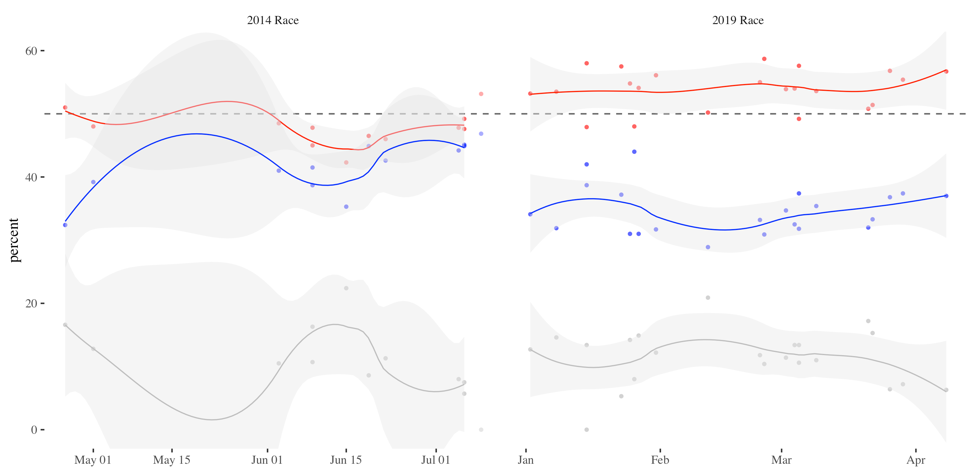
Figure 2: Trends in presidential polling 2014 and 2019 compared. Red is Jokowi, blue is Prabowo, and grey is TT/TJ (undecided). Note the closeness and volatility of the 2014 race and contrast with the stability of the large gap between the candidates in 2019.
The Prabowo campaign disputes the findings of most pollsters. Polls conducted on behalf of the Gerindra party and Prabowo campaign have apparently found much stronger support for the challenger than have other polls. These internal polls had long remained a mystery. On 9 April, however, the Prabowo campaign held a press conference at which they unveiled the results of six previously unreleased polls. These polls obtained the opposite results of other surveys, finding support for Jokowi at a little below 40%, and support for Prabowo close to 60%.
The six internal polls share several characteristics that limit their credibility. First, they are from unfamiliar polling outfits. Second, the pollsters are closely connected to the Prabowo campaign. Third, neither the pollsters nor the campaign have offered a methodological explanation for why the results of these polls differ so much from polls done by established survey institutes. Instead, the Prabowo campaign has simply claimed that other survey institutes are biased.
When pollsters are transparent, it is possible to examine how a poll was constructed and critique its approach to questions, sampling design, or weighting schemes. Exactly this discussion occurred with the widely-reported Kompas poll published at the end of March. That poll found lower support for Jokowi (49%) and higher support for Prabowo (37%) than other polls in the field at the same time. It also used a distinct sampling design with twice as many clusters and half as many respondents per cluster as other survey institutes. Since most Indonesian pollsters use a sampling design with more respondents per primary sampling unit, Kompas’ different approach is the most likely reason for its outlier finding.
Another outlier poll also used different methodology, albeit one that would not be acceptable at many survey institutes. An Indomatrik poll released in late January found that Jokowi held only a four point lead over Prabowo. Because Indomatrik shares a chief executive with Puskaptis—a survey company that was expelled from the Indonesian Public Opinion Survey Association (Persepi) over its deeply flawed 2014 quick count—the finding was greeted with scepticism. Indomatrik’s research head noted an important difference in its approach: the institute had included among supporters of Prabowo those respondents who had not stated a candidate preference but had indicated they wanted a “firm” (tegas) president. In estimating support for Jokowi, however, Indomatrik used only respondents who explicitly stated their vote preference.
While Indomatrik’s earlier divergence from polling averages can be explained by its biased model of vote intention, its newest result, with Prabowo leading Jokowi by a seven point margin, is difficult to justify. Unless Indomatrik opens its survey results to third-party auditors, its results should not be taken seriously.
Following the 2014 presidential election, seven pollsters agreed to open their records for an audit by the Indonesian public opinion association (Persepi). The graph below compares the results of recent polls done by these seven firms with the results of the internal surveys released by the Prabowo campaign.
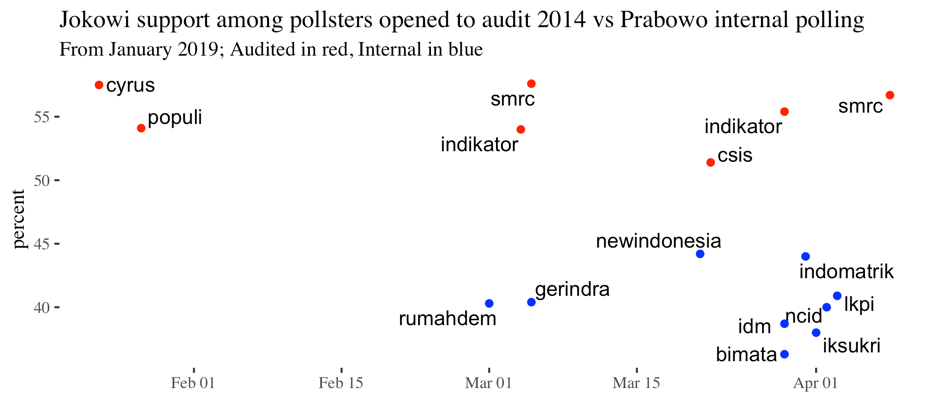
The difference between the results obtained by audited firms and those obtained by the Prabowo internal polls is striking. One might conclude from this graph that a record of transparency causes pollsters to find greater support for Jokowi.
Overall, the recent release of internal polls that diverge sharply from those obtained by better-known, more transparent polling institutes is more consistent with a campaign strategy—perhaps one aimed at generating confusion about the state of the polls—than with a sudden, massive change in public opinion.
State of the legislative race
In late 2018, dozens of newspaper articles trumpeted what looked like a culling of smaller parties currently represented in the national parliament (DPR). Until recently, only five parties have polled above the 4% national vote threshold needed to enter parliament. The history of polling in Indonesia, however, suggested even then that these parties were likely to outperform their polls and comfortably cross the threshold.
As the race stands now, PDI-P has maintained its comfortable lead, with its running average of 24% giving it nearly double the expected national vote share of second-place Gerindra, running around 12%. Golkar seems to have settled at a little over 10%, well below its 2014 performance of just under 15%. Support for the difficult-to-measure PKB seems to be around 8% of the national vote, while Partai Demokrat hovers around 6.5%—down four points from its dismal 2014 performance.
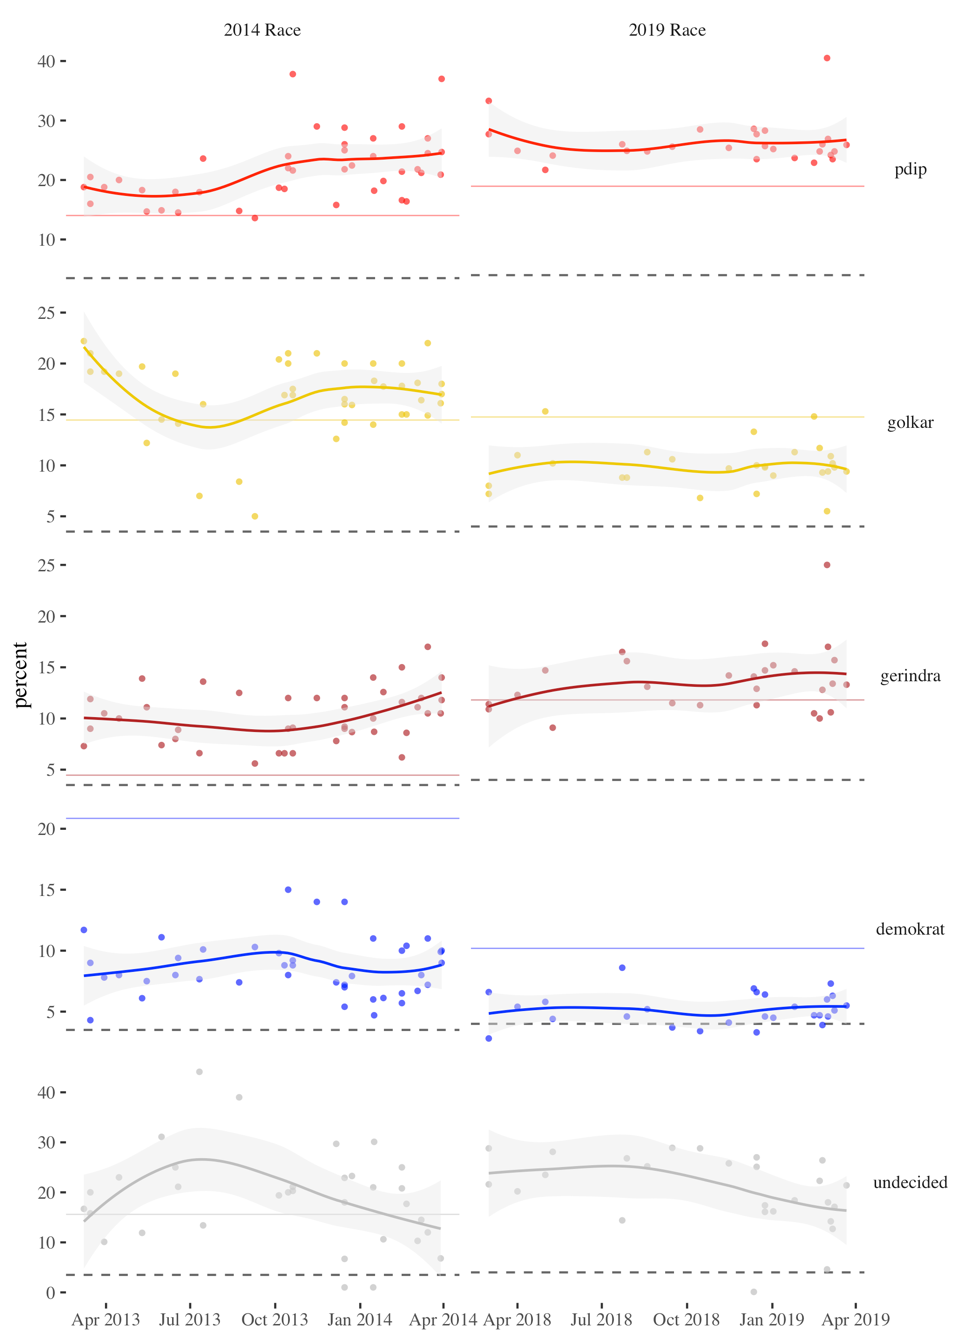
Figure 3: Performance of top four parties in 2014 compared to 2019, relative to minimum threshold (dashed line) and performance in the previous election (solid line representing 2009 and 2014, respectively). To measure performance of 2014 polls, compare curve in left graph to solid line in right graph. Note that PDI-P and Golkar underperformed their polls.
PKS and NasDem lead the smaller parties, with around 4.5% percent of polled support each. PPP and PAN each poll a bit over 3%, though PAN’s measured support has been quite volatile relative to its size. The remaining parties—incumbent Hanura, Hary Tanoesoedibjo’s Perindo, returning non-incumbents (at the national level) PBB and PKPI, the new PSI, and the new Soeharto family-connected Berkarya and Garuda—are not polling well enough to be considered contenders for seats in the national parliament. Only Perindo has polled above the threshold in credible surveys, but its measured support in recent months has fallen to about 1.5%. A comparison with NasDem, the last new party to enter parliament, suggests that Perindo is not on a similar trajectory.
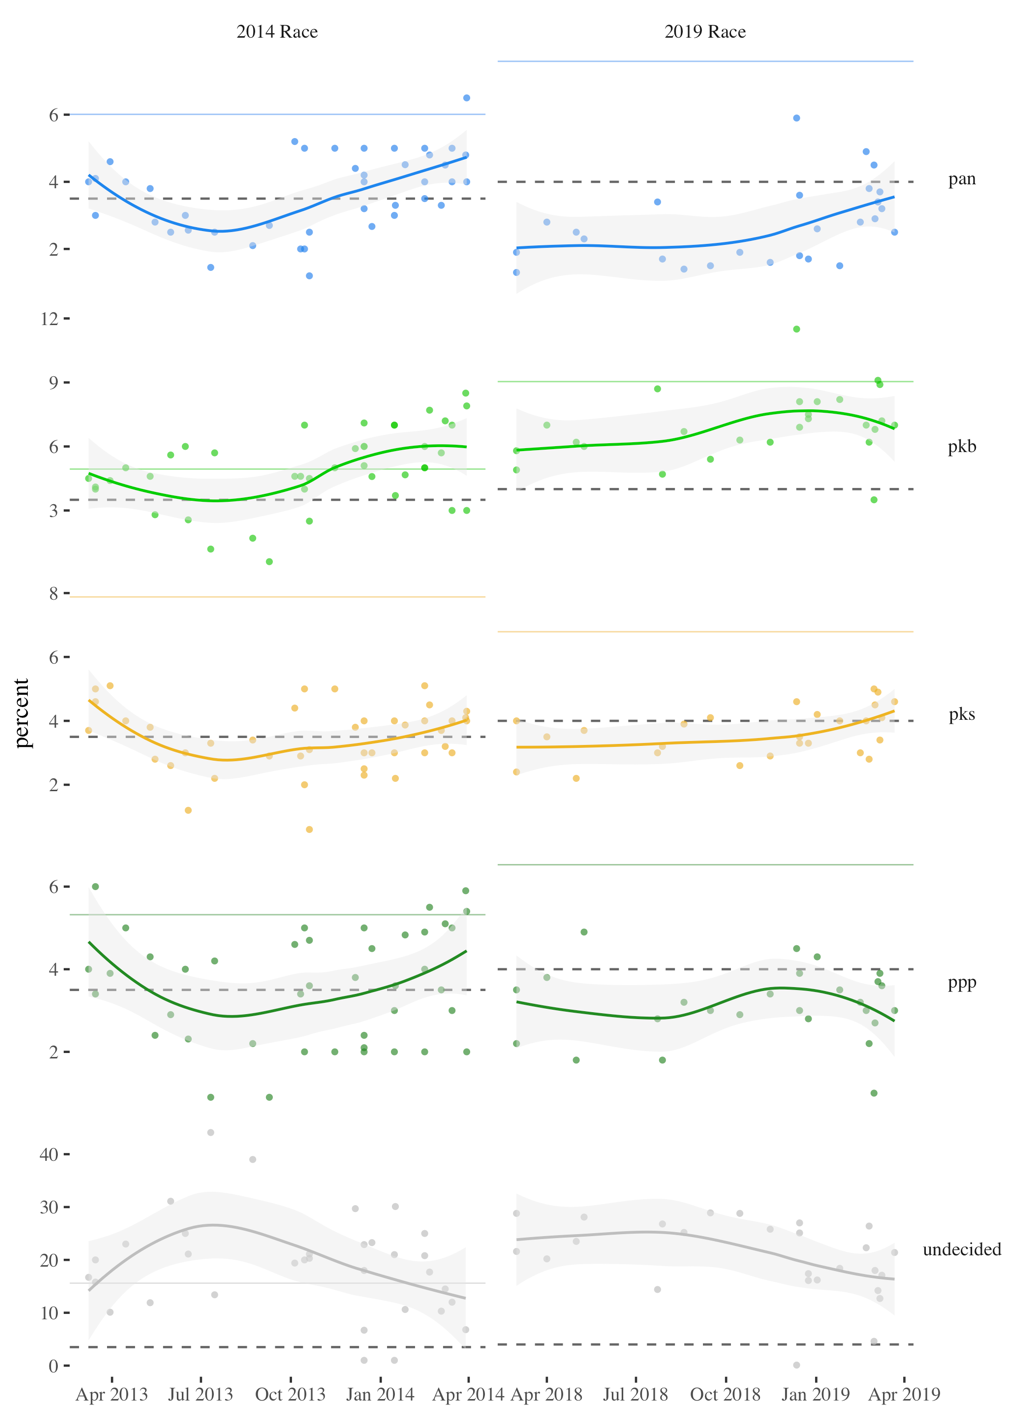
Figure 4: Performance of Islamic parties in 2014 compared to 2019, relative to minimum threshold (dashed line) and performance in the previous election (solid line representing 2009 and 2014, respectively). To measure performance of 2014 polls, compare curve in left graph to solid line in right graph. Note that all Islamic parties outperformed their polls in 2014.
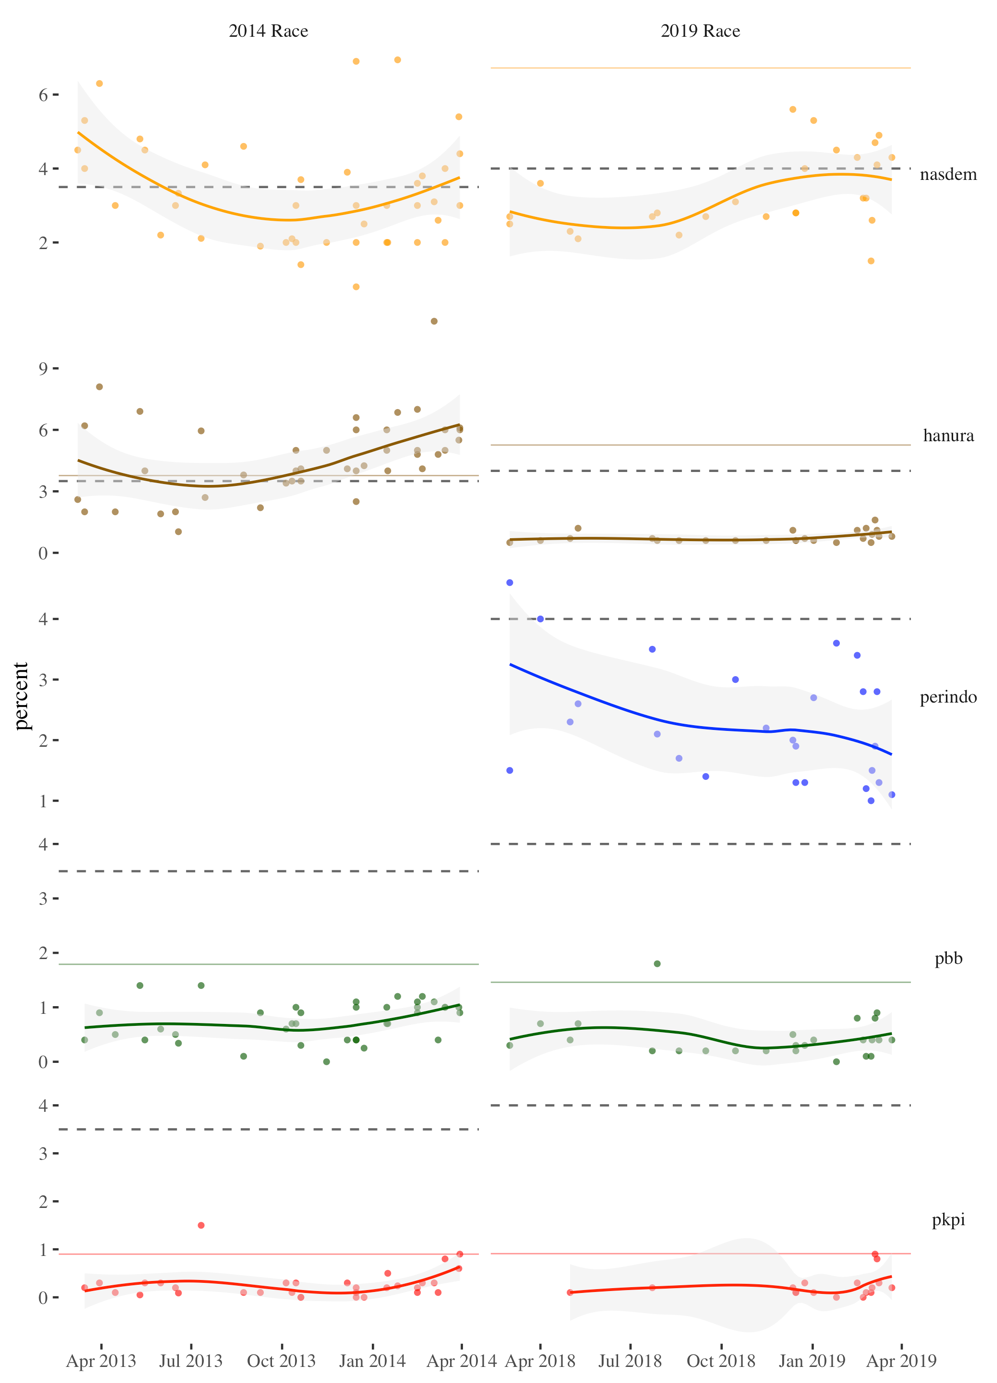
Figure 5: Performance of incumbent small and contender new parties in 2014 compared to 2019, relative to minimum threshold (dashed line) and performance in the previous election (solid line representing 2009 and 2014, respectively). Compare NasDem in 2014 to Perindo—Perindo is performing far worse than NasDem did in its first year.
Polling legislative races is difficult in Indonesia. Many parties have small support nationwide, receiving only 6–10% of the vote. Partisan identification is low, and the open-list electoral system dilutes party brands. Many candidates squeeze their campaigning into the final days of the election, after most polls have been fielded. In addition, survey respondents are less likely to express a preference in the legislative race, even as the election draws close.
One of the most important substantive questions facing a party is whether it has enough support nationwide to cross the 4% parliamentary threshold. For pollsters, it can be a nightmare to answer this question when the party is near the threshold. Depending on the sampling design, a survey with 1,200 to 2,000 respondents has a true margin of error of just under 3 to nearly 4.5 percentage points. Such surveys lack the statistical power to determine whether a party polling around 3–4% percent is going to cross the parliamentary threshold. Indeed, the margin of error on such polls can contain the entire polled vote share of a small party.
One sure way to obtain an apparently poor result in legislative election polling is to draw a survey sample from only a few provinces. Since support for smaller parties varies so much by region, a perfectly viable sampling strategy for the presidential race (which has much less geographic variation) can lead to problems in the legislative race. The pollster Roy Morgan, which samples in only half of Indonesia’s provinces, has a track record of dramatically overestimating support for PDI-P while obtaining fairly accurate measures of public opinion in the presidential race. Unfortunately, Roy Morgan appears to have repeated its 2014 mistakes, with its last pre-election poll estimating support for the PDI-P at 39%.
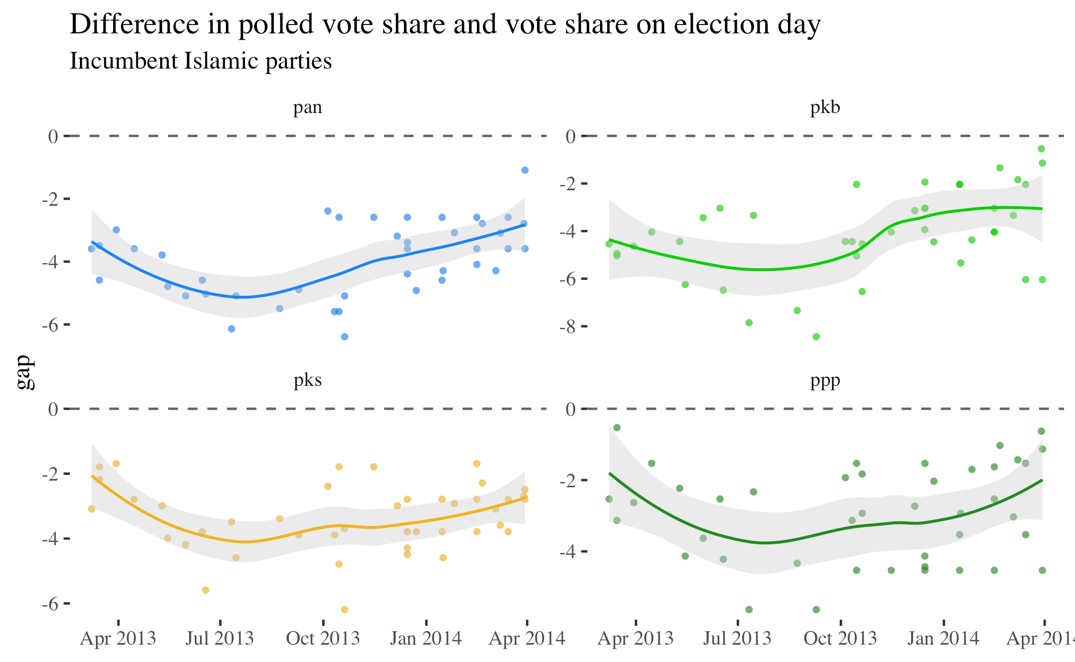
Despite these difficulties, polls of the legislative race have a good track record, with one important exception: in 2014, every poll underestimated support for Islamic parties. In addition, most polls seriously underestimated support for the then-new NasDem party. Polls in 2009 also measured support for most Islamic parties as being below a parliamentary threshold that they easily crossed on election day. Looked at together, as in the graph below, the gap between survey estimates of Islamic party support and their performance on election day is both consistent and striking.
The consistent underestimation of support for Islamic parties raises an important question: are Islamic party voters lying to pollsters? Or are pollsters’ sampling strategies and questionnaires somehow biased against detecting support for Islamic parties?
A first step to understanding why Islamic parties are underestimated is to check whether supporters of these parties are more likely than supporters of other parties to come from the body of survey respondents who did not reveal a partisan preference. If a party does better when there are more respondents with unrevealed preferences, or does not do better as the share of decided voters increases, it is a sign that the party’s voters either do not wish to disclose their partisan preference or were persuaded to vote for the party in the final week of campaigning, after polling ended.
In the graph below, I compare parties’ polled support in 2014 to the share of decided voters, that is, to the share of voters who indicated a preference for any party. The level of support is standardised to place each party on the same visual scale. Absent either a marked decline in a party’s support over time or a tendency among a party’s eventual supporters to not reveal a partisan preference to pollsters, the level of support for every party should increase with the share of decided voters.
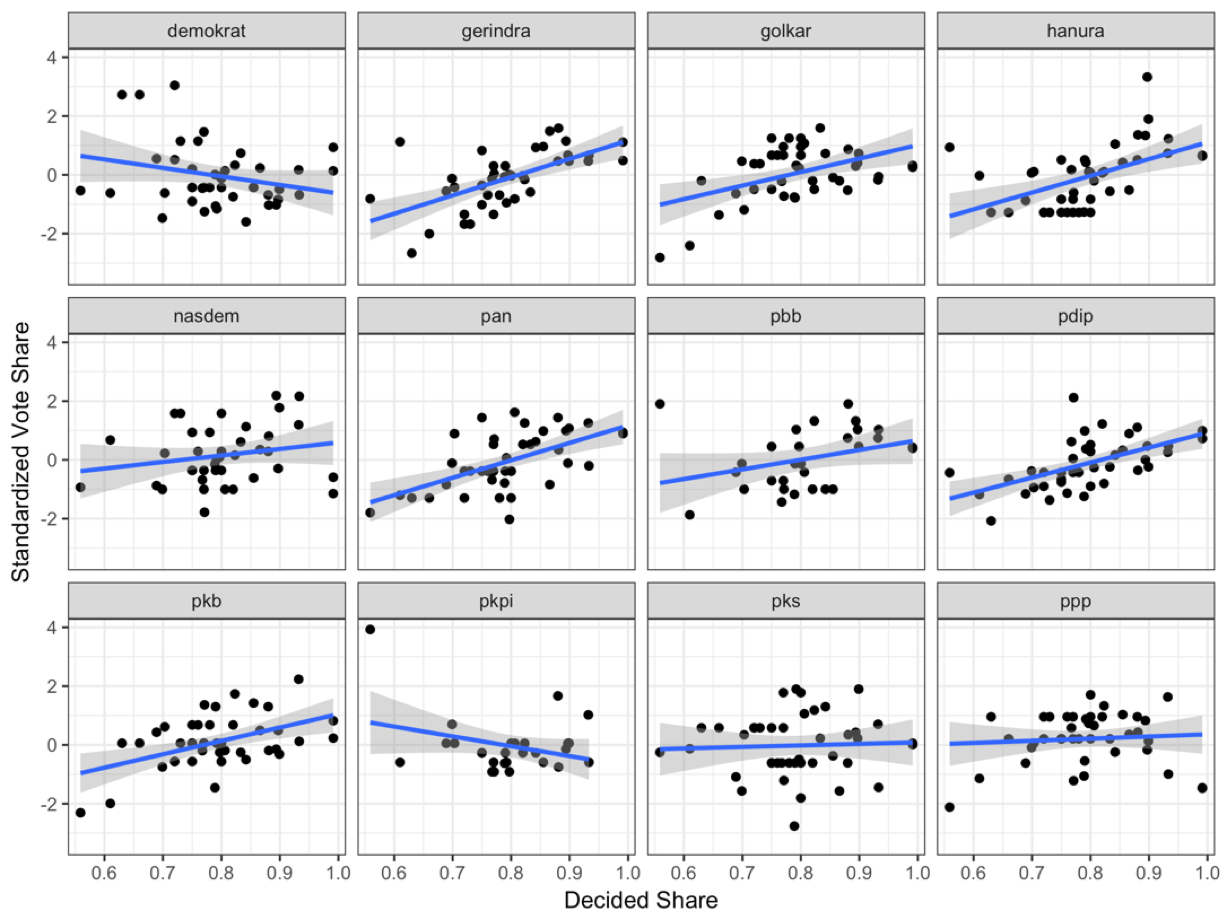
Figure 6: Relationship between share of decided voters and support for the party. Since “undecided / did not respond” is normally the largest “party” in polls, any increase in the share of decided voters should benefit all parties (though not equally). If there is an especially weak relationship between decided share and a party’s support, it is one sign that survey respondents who support that party are less likely to reveal—or not to have—a preference for that party when they were surveyed.
As expected, the relationship between decided share and polled support is positive for most parties. Since Partai Demokrat began the race with much higher polled support than they received later in the race, and the decided share increased closer to the election, its relationship to decided share is negative. When controlling for poll timing, the negative relationship disappears. (PKPI’s negative relationship is driven by a single early outlier poll.)
Two Islamic parties stand out. For PKS and PPP, the relationship between decided voter share and polled level of support is non-existent. That lack of correlation remains even when poll timing is controlled for. This suggests that eventual supporters of PKS and PPP are, for some reason, more likely than supporters of other parties to not indicate a partisan preference to pollsters. It may be that PPP and PKS supporters are more reticent to express their preferences; alternatively, these parties may be especially effective in their late-stage campaigning.
Pollsters underestimated support for all Islamic parties, not just PPP and PKS. This means that something other than concealed or unformed preferences is needed to explain pollsters’ consistent underestimates of support for PAN and PKB.
Since support for Islamic parties is strongly correlated with geography, one possibility is that the sampling strategies pollsters use make them less likely to sample supporters of Islamic parties relative to supporters of other parties. In particular, pollsters may face a rounding problem when measuring support for Islamic parties in their strongest constituencies, leading them to systematically underestimate the parties’ support in strongholds without those errors being balanced in other regions.
The mechanics of the rounding problem are a bit complex, but they boil down to the fact that surveys can only interview people, and these people must be counted in whole numbers. When, for example, 19 Yogyakarta respondents were sampled in a 2014 national survey, the expected number of PAN supporters (based on the share of the vote PAN ultimately won) would have been 3.23. Since respondents come in whole numbers, the surveyor correctly obtained three PAN supporters—accurate given the numerical constraints, but an underestimate in PAN’s second-strongest province. Geographic variance in support and limited sample sizes can sometimes interact to induce systematic underestimates in areas of higher support.
Every party with a geographically concentrated base but relatively low support nationwide might be subject to this kind of bias. If this is the case, then surveys with larger sample sizes should consistently detect higher support for Islamic parties than surveys with smaller ones.
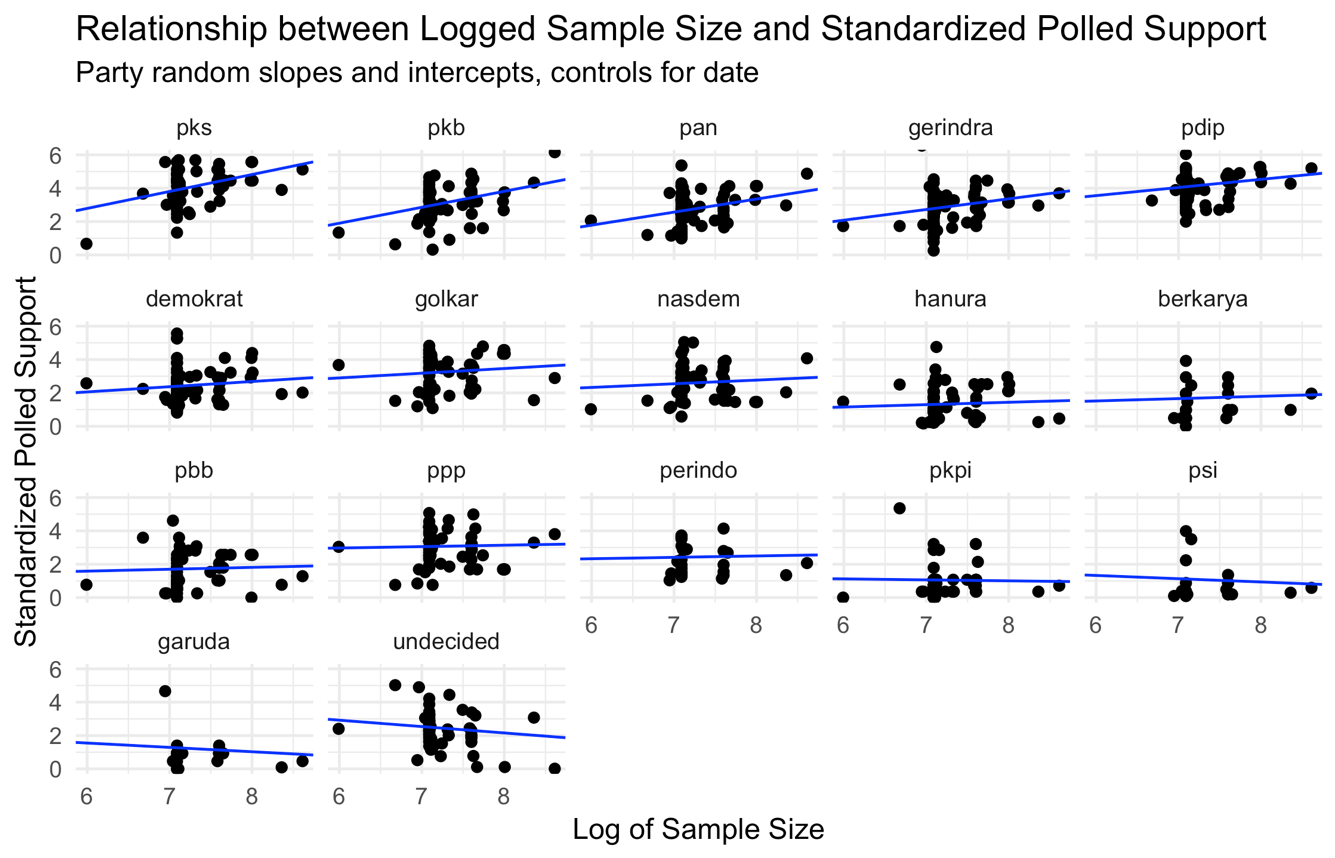
Figure 7: If sample size creates a bias in which a party is systematically underestimated, there should be a stronger positive relationship between sample size and support for that party. Here, we see a strong relationship between sample size and measured support for PKS, PKB, and PAN, but not for PBB or PPP.
The graph above compares sample size to standardised polled support in both the 2014 and 2019 election. The sample size variable on the x-axis has been adjusted to make the graph easier to read. The regression line shows the relationship between sample size and party support, taking into account the date of the poll.
Three Islamic parties—PKS, PKB, and PAN—show the strongest relationship between sample size and polled support. PPP does not. While about half of the parties have a moderately positive relationship between polled support and sample size, it is the Islamic parties who have been consistently underestimated, and thus whose relationship with sample size needs further explanation. Since support for three of the Islamic parties does appear to increase with sample size, there is some evidence to support the hypothesis that sampling design contributes to the consistent underestimation of some Islamic parties.
How ‘moderate’ are Indonesian Muslims?
The numbers on how Indonesia stacks up in comparison to other Muslim-majority countries.
Because pollsters have so consistently underestimated support for Islamic parties, and because sampling designs have not changed since 2014, I expect the incumbent Islamic parties to outperform their polls by at least two percentage points. Those who hope that Islamic parties polling near the 4% parliamentary threshold will fail to return to parliament will be disappointed on election day.
Indonesia’s pollsters have a strong record of accuracy in national races. In 2014, polls of the presidential race consistently detected a close race with Jokowi ahead, which is exactly what happened. In the legislative race, polls accurately measured the relative level of support for the parties, even as they underestimated support for all Islamic parties. Their biases in measuring Islamic parties were, in absolute terms, small, and reflect challenges all pollsters face when making measurements in a fragmented party environment.
Based on the polls as they stand today, I expect that Jokowi will win by a wide margin, PDI-P, Gerindra, Golkar, and PKB will dominate parliament, the Islamic parties will beat their polls, all incumbent parties except Hanura will return, and no new party will cross the parliamentary threshold.