 Facebook
  Twitter
  Soundcloud
  Youtube
  Rss
Rss Regular readers of New Mandala will know that I sometimes like to produce graphs, partly to display my statistical sophistication! These two are my modest contribution to recent discussion on New Mandala about the underlying economic drivers of political conflict. They both relate to the productivity of labour (expressed in terms of GDP per worker) in the agricultural and industrial sectors. All data are taken from the World Bank’s World Development Indicators.
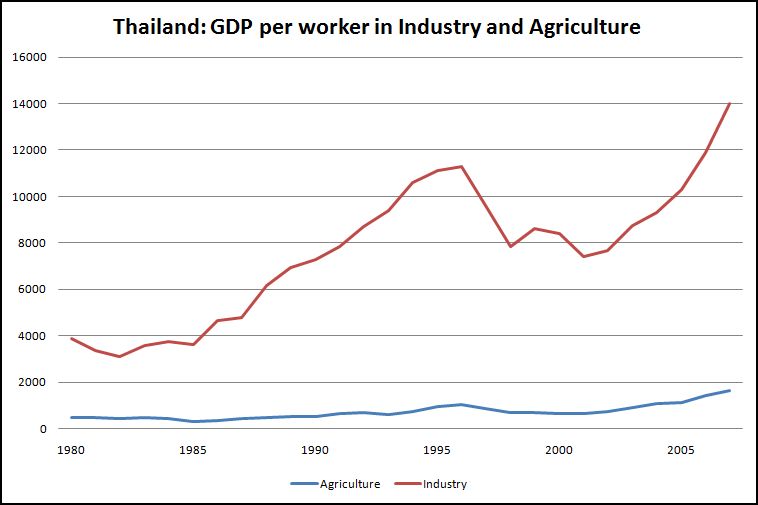
The first graph starkly illustrates the productivity gap between agriculture and industry in Thailand. This gap widened notably during the rapid economic growth of the 1980s and 1990s, but narrowed after the economic crisis of 1997. (Units are $US)
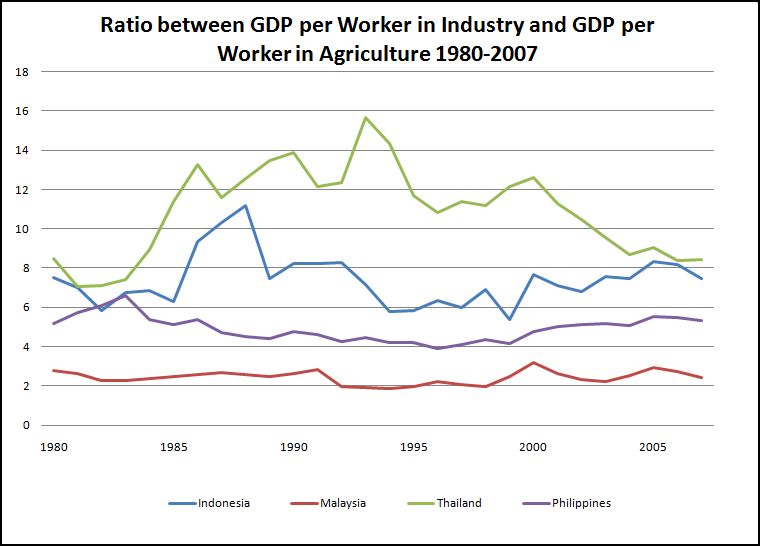
The second graph sets out the ratio between GDP per work in industry and GDP per worker in agriculture for Thailand, Indonesia, Malaysia and the Philippines. Thailand has the highest ratio for the entire period (1980 to 2007) though it comes close to Indonesia at the beginning and the end. Interestingly the ratio in Thailand declines steadily from 2000 to 2007, partly due to an significant increase in agricultural productivity (from about US$600 per worker to about US$1600 per worker). Is this increase in agricultural productivity (and the narrowing of the gap between agricultural and industrial productivity) a product of Thaksin-era policies? Has the expansion of contract farming increased agricultural productivity?
I would greatly appreciate any comments that New Mandala readers (who are more economically literate than I) have on these graphs.
[Methods. Sectoral GDP is based on World Development Indicators on total GDP (current US$) and the percentage GDP share of different sectors. Sectoral workforce is based on the total workforce and the percentage workforce share of different sectors.]