 Facebook
  Twitter
  Soundcloud
  Youtube
  Rss
Rss 
How do Indonesian provinces vary in the levels of religious tolerance among their Muslim populations? Which province is the most tolerant and which one is the least? And how do we measure religious tolerance across regions using the tools of survey research? Having an answer to these questions is important, as it can help us understand how tolerance at the local level is influenced by local political dynamics, or how levels of tolerance might fluctuate over time.
But despite ample survey research on religious tolerance in Indonesia, these seemingly simple questions have not been satisfactorily answered. Most existing studies have overlooked the importance of subnational variation altogether, and those that look at the topic employ statistical methods that do not really allow proper comparisons, or measurements of the tolerance/intolerance construct.
Religious tolerance has political and social aspects. Politically, religious tolerance means Muslims’ willingness to respect the rights of non-Muslims. Socially, religious tolerance means a general positive orientation toward followers of other religions. This is more related to stereotypes, feelings, and absence of prejudice.
Some survey research, (for example the Wahid Foundation’s 2016 study or Lembaga Survei Indonesia’s 2006 survey) has attempted to provide a picture of tolerance on both the national and subnational levels. Another study by the Ministry of Religious Affairs (MoRA) in 2013 is particularly noteworthy. It surveyed 3,300 individuals in 33 provinces to compare the provinces’ levels of tolerance (or, as MoRA put it, “religious harmony”).
These studies’ approach is straightforward: respondents answer a set of questions on tolerance. Each respondent’s answers to the questions are then averaged to calculate the respondent’s tolerance score. If the researcher wants to calculate province-level tolerance scores, he or she does that by averaging the tolerance scores of respondents who reside in each province.
While commonly used, such an approach suffers from three limitations. The first is the problem of weighting: by simply averaging each respondent’s responses on the tolerance questions, the researcher implicitly assumes that all of the tolerance questions are equal in importance. The researcher, of course, can weight the questions differently a priori. But that would assume that respondents also share the researcher’s perception of the questions’ relative importance.
The second problem is the problem of sparseness: often, respondents have to be discarded because they do not answer the full set of questions. This would mean a loss of information.
Lastly, there is the issue of statistical uncertainty. Calculating province-level scores by simply averaging across respondents in each province gives us a general estimate for each province, but no information about the uncertainties surrounding that estimate. (As an analogy, it would amount the same thing as having no information about margin of error in a survey). This, in turn, hinders our ability to examine if differences between provinces are statistically significant.
Estimating tolerance with Bayesian model
To address the aforementioned limitations, we can employ a Bayesian item response model (Bayesian IRT) in analysing the results of surveys on tolerance. (A detailed discussion of Bayesian models is beyond the purview of this piece, but interested readers are encouraged to consult various work on the topic.)
Bayesian IRT enables us to address the aforementioned limitations. It addresses the problem of weighting by automatically assigning greater weights to questions that better differentiate between tolerant and intolerant respondents. This weight assignment, in turn, enables us to also examine which questions or topics are more sensitive when it comes to religious tolerance.
In terms of the problem of sparseness, the Bayesian approach is better equipped to handle missing data due to its iterative estimation process and the use of prior information. This means that we can keep all respondents as long as they answer at least one question. Loss of information can therefore be kept to a minimum.
Lastly, the approach gives us not only a general estimate for each of the provinces but also a measure of uncertainties (called a credible interval) surrounding each of the estimates. This means that we can quantify our uncertainties and check if two provinces’ levels of tolerance are statistically different from each other.
In October 2016, I embedded five questions about Muslims’ tolerance of Christians in a national SMRC survey of 1,035 respondents. Each question has four possible answers ranging from “1” (strongly disagree) to “4” (strongly agree). I recoded the responses so that higher scores reflect higher tolerance.
Table 1. Tolerance Questions Used in the Study
| 1. Christians are often dishonest and self-interested. |
| 2. Indonesia would be a better place if there were no Christians in this country. |
| 3. Christians have the right to be elected as regent, mayor, or governor, even in regions where Muslims are the majority. |
| 4. I would be opposed if there was a church being built in my neighbourhood. |
| 5. Christians must be allowed to stage demonstrations to protest discrimination against their religion. |
As the goal was to estimate and compare Muslims’ levels of tolerance across Indonesian provinces, I analysed only 925 respondents who identified Islam as their religion.
Figure 1 presents the weights (also called discrimination coefficients as they discriminate between tolerant and intolerant respondents). Each weight estimate has a 95% credible interval (represented by the line), which tells us the top 95% most possible values for the weight, and a distribution (represented by shadow behind the line), which tells us all possible values for the weight uncovered during the estimation process.
These weights indicate how well the questions discriminate between tolerant and intolerant respondents. The greater the weight, the better the question is in discriminating tolerant and intolerant respondents.
Questions that asked respondents whether or not they agreed that a) Indonesia would be a better place if there were no Christians and b) whether or not they agreed that Christians have the right to be elected for public offices have the highest discrimination coefficients. This means that these questions are the ones better able to tell us which respondents are tolerant or intolerant. Future studies would benefit from including these two items, to gain more statistical variation in the respondents’ answers (that is, preventing them to unanimously agree or unanimously disagree on the questions) and to more accurately capture Muslims’ attitudes toward non-Muslims.
Questions on church building and the right to stage demonstrations, on the other hand, have relatively low weights. This suggests that tolerant and intolerant respondents do not really differ in their answers to these items. They all could agree or they all could disagree.
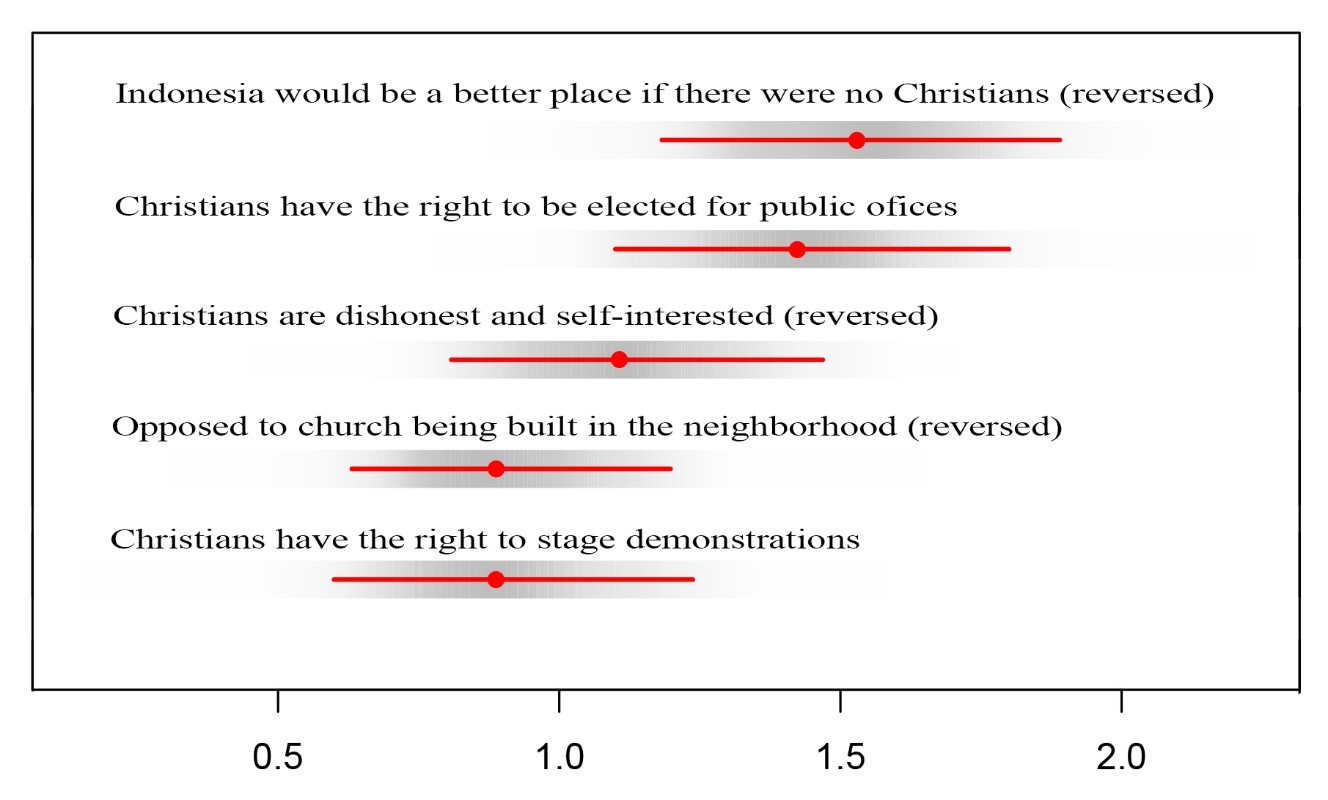
Figure 1. Discrimination Coefficients of the Questions
Figure 2 presents estimates of the provinces’ levels of religious tolerance. The higher the score, the higher the level of tolerance in the province is. The figure also presents the number of respondents in each province in parentheses.
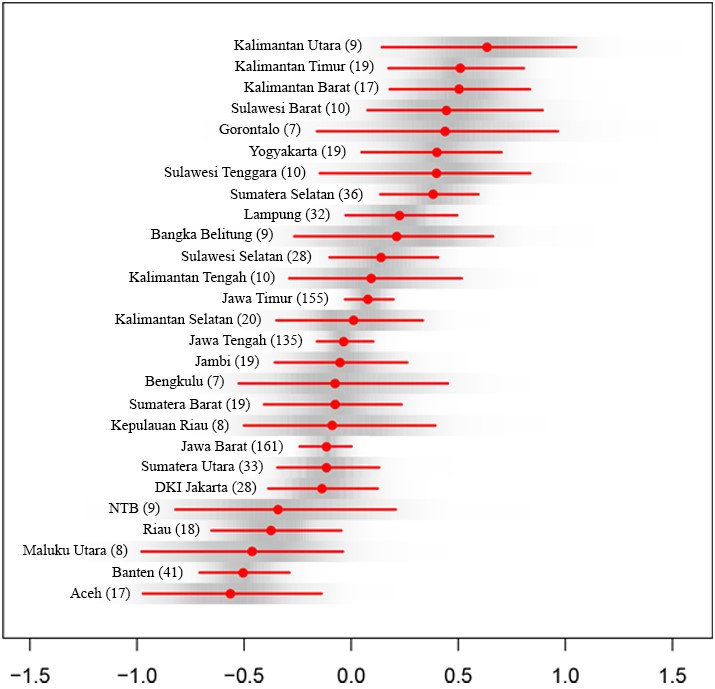
Figure 2. Levels of Religious Tolerance across Indonesian Provinces
We can see at least two notable patterns. First, provinces with more respondents have narrower credible intervals that reflect our greater certainty about their levels of tolerance. (This is practically, but not conceptually, similar to the concept of margins of error in survey methodology.) Our estimates become more precise as we have more respondents—something to keep in mind for future research.
Second, there is indeed a substantial variation in the provinces’ levels of tolerance. Broadly speaking, Aceh is the least tolerant and Kalimantan Utara the most tolerant. Among the provinces in Java, Banten is the least tolerant, followed by Jakarta, Jawa Barat, Jawa Timur, and Yogyakarta.
This picture gets more nuance once we consider the credible intervals. As a very basic rule, two provinces’ tolerance levels are statistically different at the conventional 95% level if their credible intervals do not overlap at all, or if the proportion of overlap is less than 50%. For example, Aceh and Banten are actually not that different because their credible intervals perfectly overlap, but Banten and Jakarta are because less than 50% of their intervals overlap. In fact, from the plot we can see that Banten is significantly less tolerant than the other provinces in Java.
I checked the validity of the provincial scores by correlating them to the aforementioned harmony score produced by the Ministry of Religious Affairs (MoRA) and a religious freedom score produced by the 2014 Indonesian Democracy Index (IDI). The IDI project, a cooperation between UNDP and the Indonesian government, takes a different approach as it does not use public opinion surveys. Rather, it relies on news articles, in-depth interviews, and focus group discussions to measure quality of democracy across provinces, including their levels of religious freedom.
The correlation between my score and IDI’s is a respectable r=.422 and is statistically significant, whereas the correlation between my score and MoRA’s is r=.265 (not statistically significant). The lower correlation with the MoRA study seems to be driven by the lack of validity of the MoRA score itself than of my score, as the MoRA score has an even lower correlation with the IDI score (r=.083, not statistically significant).
Future research
What can we use the score for? There are at least two avenues for future research. First, we can use the score to understand how variation across provinces is related to or influenced by provinces’ quality of democracy, levels of economic development, and the vote shares of Islamic parties. Does higher quality of democracy or more effective governance have a positive effect on the level of tolerance of their Muslim populations?

Sitagu Sayadaw and justifiable evils in Buddhism
One of Myanmar's most revered monks reassures soldiers that norms of nonviolence are suspended in the course of defending the faith.
One of the ways in which such a temporal look at tolerance can be useful is that it will enable us to answer what causes the (seemingly more frequent) acts of intolerance reported in the media or by civil society organisations (CSOs). Is this perception of increasing intolerance indeed caused by an increase in intolerance among the masses? Is it an “illusion”, created by a higher awareness and willingness from the media or CSOs to report such acts? Or is it simply caused by a few religious vigilante groups that are becoming more daring in their actions?
Some studies have done this by fielding the same questions in different years and examining how the levels of tolerance fluctuate over these years. This approach, however, is limited as it ignores sampling variability and the possibility that samples from different years read or understand the questions differently. A Bayesian approach, on the other hand, is relatively less constrained by these assumptions.