 Facebook
  Twitter
  Soundcloud
  Youtube
  Rss
Rss 
A four centuries long downward trend means grain prices aren’t set to soar any time soon, writes Jim Plamondon.
A decade ago, when grain prices spiked sharply upwards, many were convinced that rising grain prices were the ‘new normal.’
Influenced by new factors such as the economic emergence of China, global climate change, population growth, water shortages, and more, surely the price of grain (and especially rice) would continue to rise… right?
Wrong.
Grain prices have been on a downward trend for over four-hundred years. Recent research suggests that this centuries-long downward trend is likely to continue until at least 2050.
Let’s start by skimming four-hundred years of history in just a few charts.
Figure 1 below (from Hearfield 2009) shows the cost of a loaf of bread (and hence of grain) in Britain from 1575 to 1825 (250 years). It shows the cost decreasing in “real” terms (as a percentage of wages, on the left-hand scale) by approximately 75% (from 27% to 7%). The red arrow (added by me, in this and all subsequent figures) emphasises this downward trend.
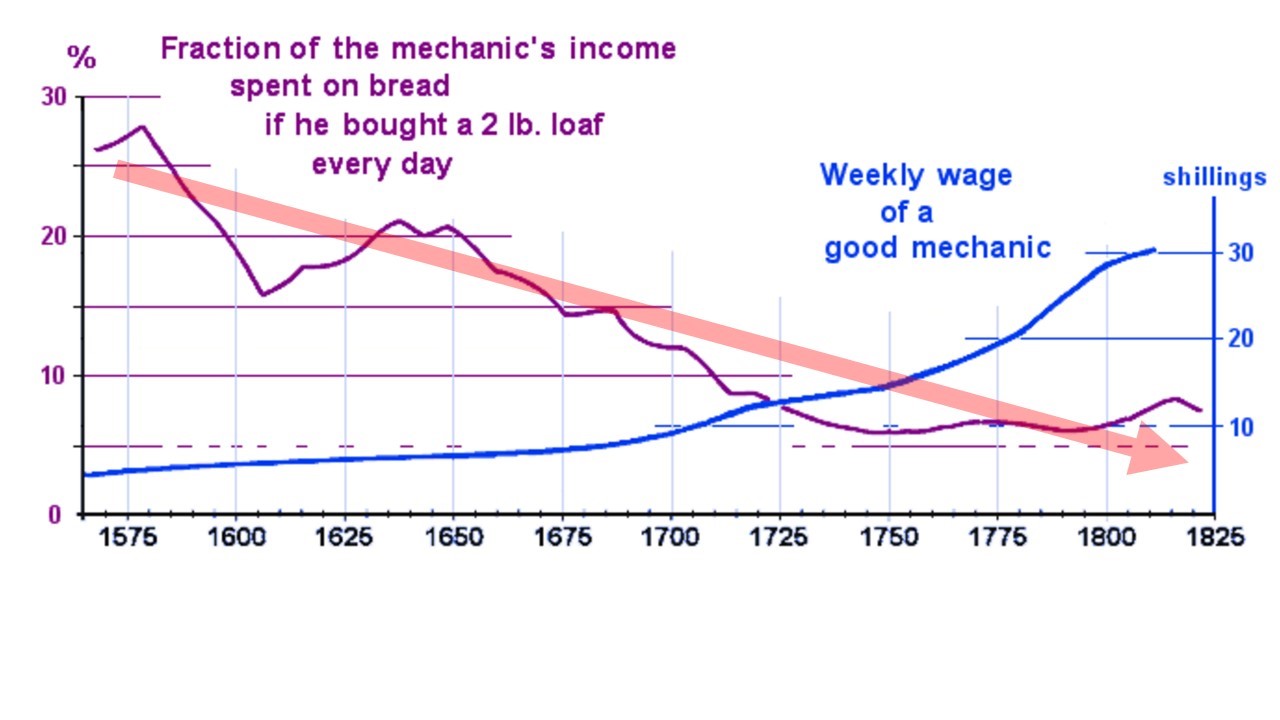
Figure 1: The cost of a loaf of bread in Britain, 1575-1825.
In 1575, Britain was an entirely agrarian island nation of approximately four million people. But by 1825, it was the industrial leader of a global empire, with approximately 10 million in the same area. In between, the Little Ice Age froze the Thames solid at its peak in the 1600s, followed by global warming (relatively speaking) in Figure 1’s latter centuries.
In short, this centuries-long period included social, economic, and climatic changes that are similar to those that today’s world faces in the next few decades. Despite these dramatic changes, the wage-adjusted cost of a loaf of bread – and hence, the price of grain – fell by approximately 75%.
The downward trend in grain prices accelerated in the 20th century, as seen in Figure 2 below (USDA), falling by approximately 75% in a single century. Inflation-adjusted prices peaked upwards briefly during world wars and, more recently, following spikes in the price of oil, including the 1970s OPEC embargo and the 2007-8 oil price shock. Each grain price spike was followed by a downward over-correction that was deeper than the long-term trend.
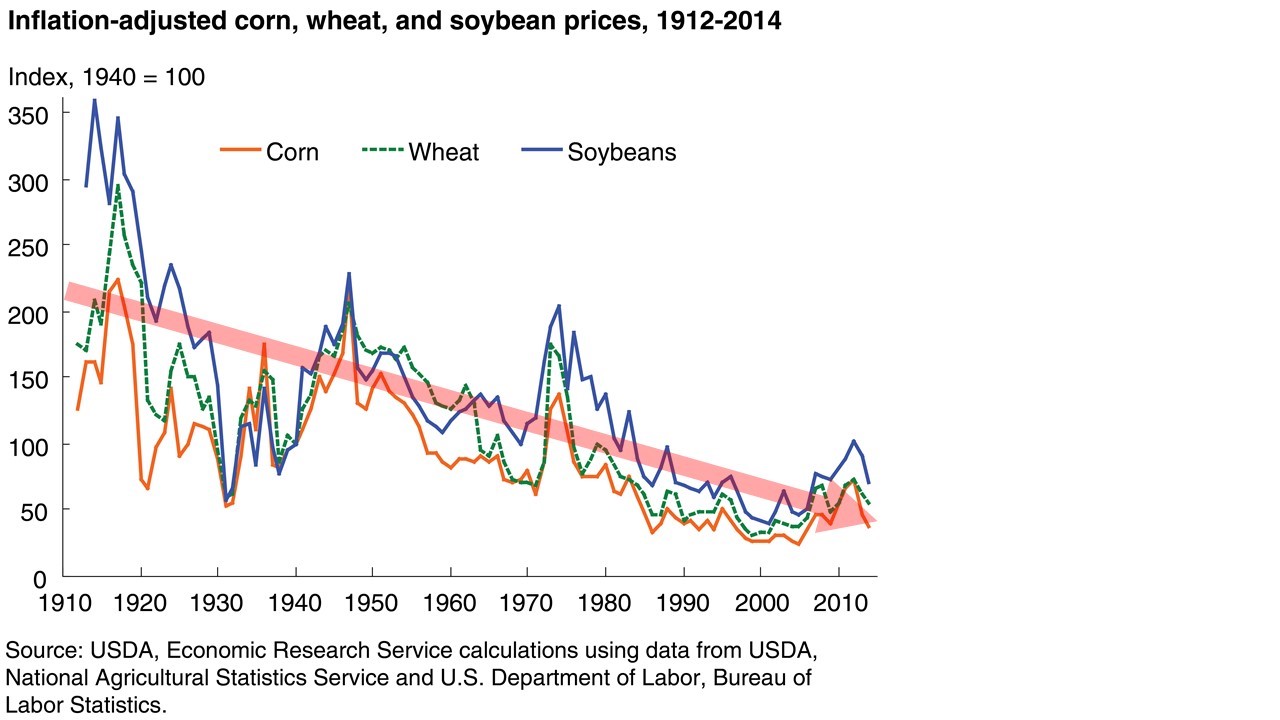
Figure 2: The price of grain in the USA, 1912-2014.
The data from the USDA chart ends in 2014. What has happened since then? Figure 3 below (Bloomberg) shows a reversion to the centuries-long downward trend.
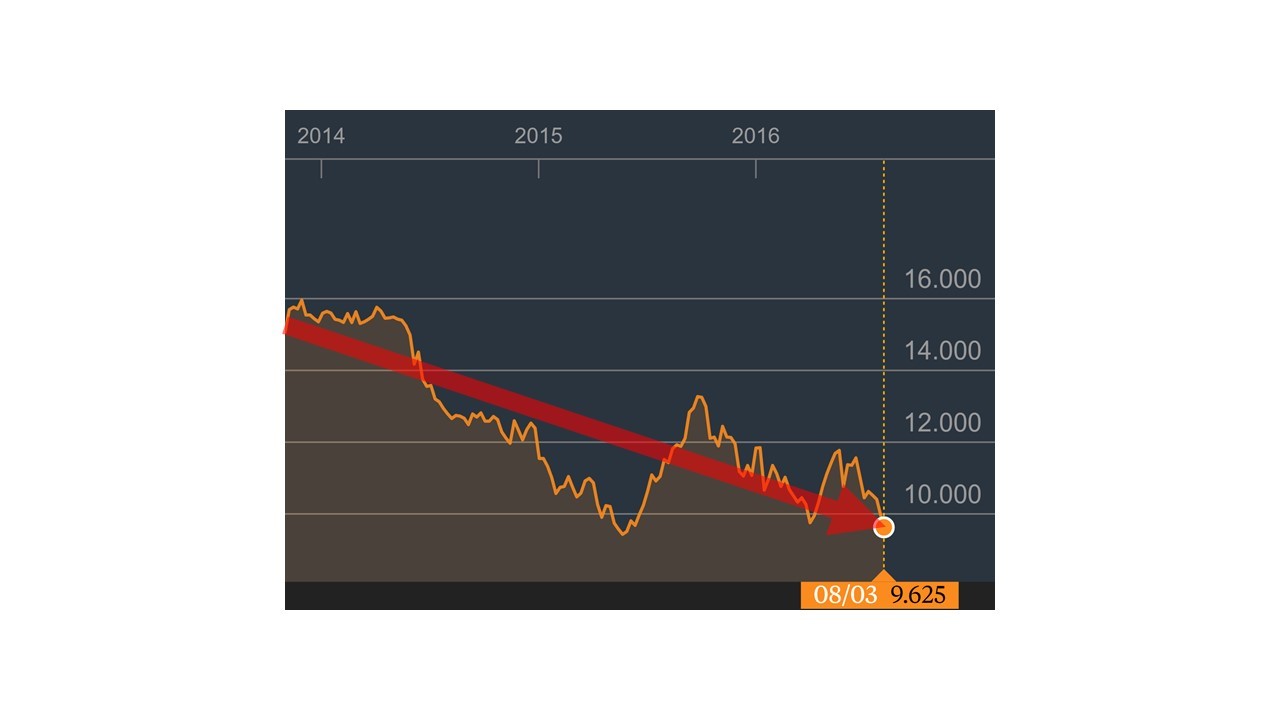
Figure 3: The price of commodity rough rice globally, 2014-Present.
Clearly, the historical trend has been downward for more than 400 years. One might agree that this was true, and yet argue that “this time it’s different,” perhaps due to global climate change, population increases, changing dietary habits, the end of the Green Revolution’s productivity gains, water shortages, and the economic rise of rice-loving Asians, among many factors.
Baldos et. al. studied that question in detail, publishing a working paper in 2014 and a follow-up in 2016, provocatively titled Debunking the ‘new normal’: Why world food prices are expected to resume their long run downward trend.
They built a historically-predictive model of grain price influences, and then added to it all of the potential new influences that might make it “different this time.” Then, they ran the model repeatedly, varying the inputs. The results were clear (see Figure 4 below).
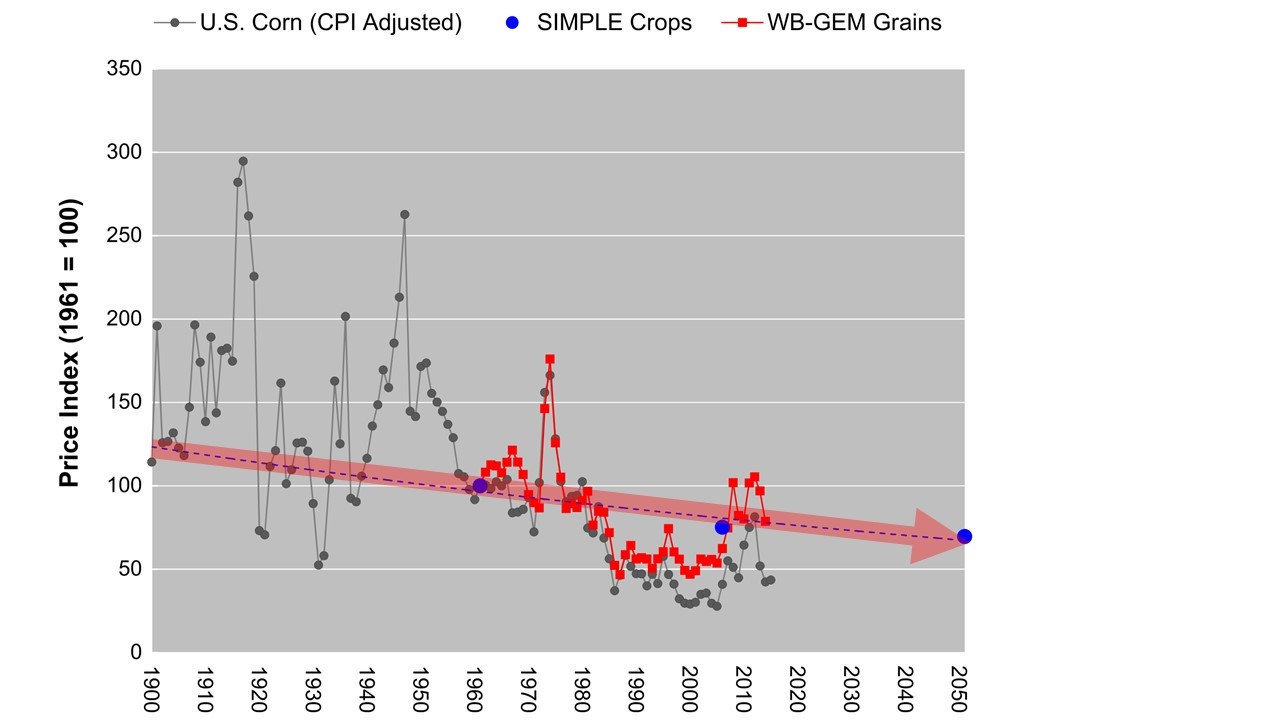
Figure 4: Global commodity grain prices projected through 2050. The trend is more than twice as likely to be down than flat or up.
According to their research, grain prices have a 72% chance of returning to their historically-downward trend, and only a 28% chance of rising or remaining flat, between now and 2050. That is, between 2015 and 2050, the price trend is more than twice as likely to be down than flat or up.
The OECD and FAO recently concurred.
Their July 2016 publication, the OECD-FAO Agricultural Outlook 2016-2025, states that grain prices are likely to fall, and includes Figure 5 below (for rice, see the right-most chart in Figure 5). Notice that the real (that is, inflation-adjusted) price of rice is expected to fall more steeply than the other grains.
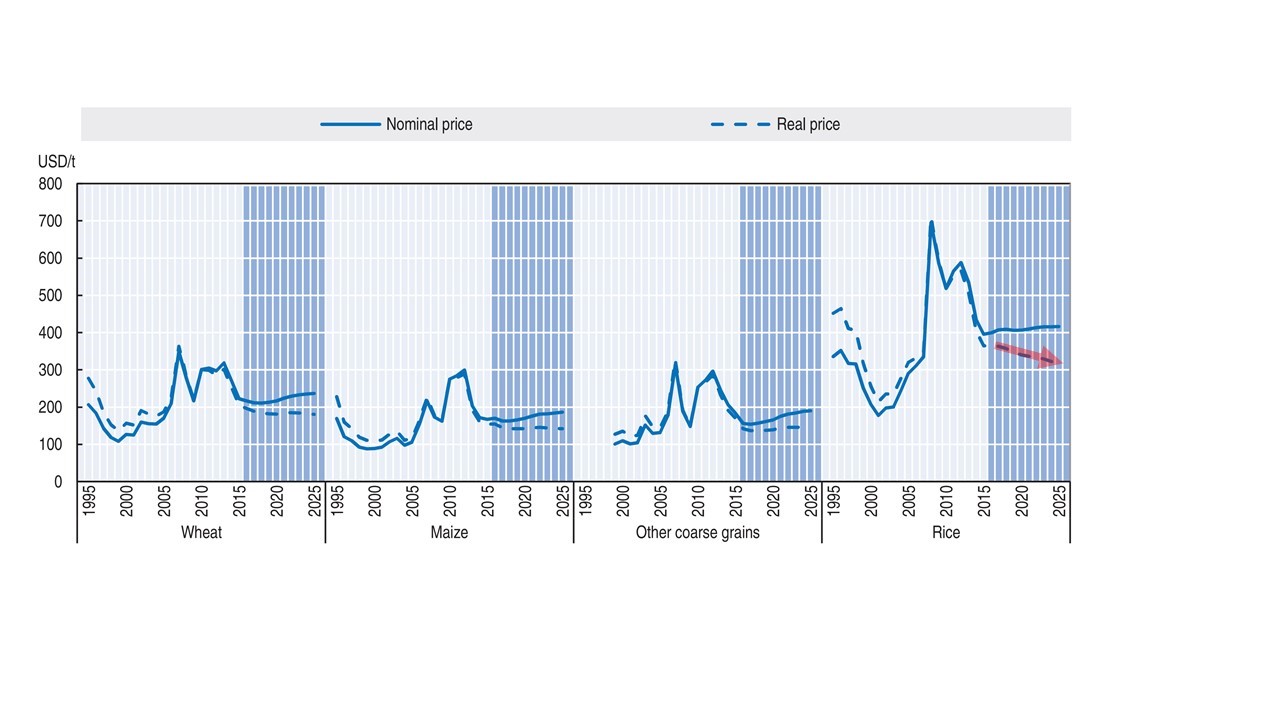
Figure 5: OECD-FAO projects falling grain prices, 2016-2025.
With all that in mind, what’s a decision-maker to do?
There’s a financial rule called the Kelly Criterion which states that, all else being equal, you should divide your investments according to the likelihood that they will pay off.
Knowing this (and all else being equal), the wise investor – including aid agencies, development organisations, government ministries – would invest 72% of their available funds into proposals that would prosper despite commodity rice prices declines, while putting only 28% into proposals that would prosper only if commodity rice prices were flat or rising.
Taking the profitability of the different investments into account might skew the investments even further towards investments that would prosper when commodity grain prices fell.
The bottom line — hedge your bets. The “safe” path of simply increasing the production of commodity rice isn’t safe anymore… because after 400 years, prices are still trending down.
Formerly a high-tech marketer with Microsoft and Rackspace, Jim Plamondon now lives in a rural Cambodian village. There, he’s exploring ways to help Cambodia profit from its rice industry, of which his company, AwardBest, is a very small part.