 Facebook
 Twitter
 Soundcloud
 Youtube
 Rss




Statistics Indonesia (Badan Pusat Statistik/BPS) claims that Indonesia’s middle class is shrinking. The agency’s figures show that the middle class fell from a peak of 59.5 million people in 2018 to 46.7 million people in 2025. Leading economists and political scientists have argued that this shrinkage helps explain recent protest waves in Indonesia.
But the middle class—as measured by BPS—is not shrinking because middle-income Indonesians’ standards of living are declining. Rather, it is shrinking due to a strange definitional choice: the threshold for middle-class status is set as a fixed multiple of a weakly relative poverty line that is pulled upwards by both inflation and the population’s improving standard of living.
This choice needs to be reconsidered so that changes in the size of the middle class correspond to genuine shifts in the standards of living of middle-income Indonesians. Doing so will help us better understand Joko Widodo and Prabowo Subianto’s economic records.
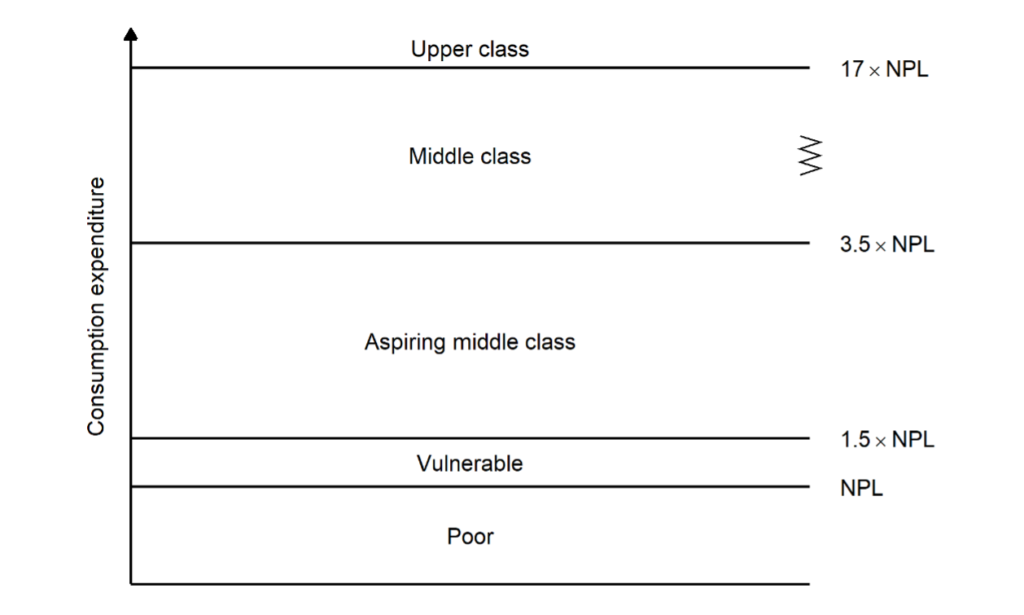
BPS’s choice can be traced back to a 2019 World Bank report that defined five consumption classes using four thresholds set as fixed multiples of Indonesia’s national poverty line (NPL). The middle-class threshold was set at 3.5 times the NPL. This means that if the NPL increases by 5% annually, the middle-class threshold also increases by 5% annually. The report’s underlying logic is a vulnerability to poverty approach: it claims that households with consumption expenditure greater than 3.5 times the NPL have a less than 10% chance of becoming poor or vulnerable in the following year.
Figure 1: The World Bank’s Indonesian consumption classes
To decide whether this is a reasonable approach, we need to understand the methodology used to calculate the NPL. Unlike the consumer price index (CPI), the NPL is not calculated by surveying the changing price of a fixed basket of goods. Instead, BPS calculates the NPL through a complex process that involves using National Socioeconomic Survey (Survei Sosial Ekonomi Nasional/SUSENAS) data to estimate how much it costs households in a reference population to consume 2,100 calories per person per day, along with a separate calculation for non-food items.
The 2019 World Bank report assumes that this methodology makes the NPL a cost-of-living index that can be used to update consumption class thresholds and thus facilitate meaningful analysis of classes’ changing sizes over time. However, as economists studying poverty have long argued, the NPL cannot be regarded as a cost-of-living index. This is because the cost of 2,100 calories rises as households’ standards of living improve and they incorporate more nutrient-rich foods into their diets. The annual increase in the NPL is therefore driven by two distinct factors: cost-of-living increases (inflation) and improvements in the reference population’s standard of living (for instance, more meat-heavy diets).
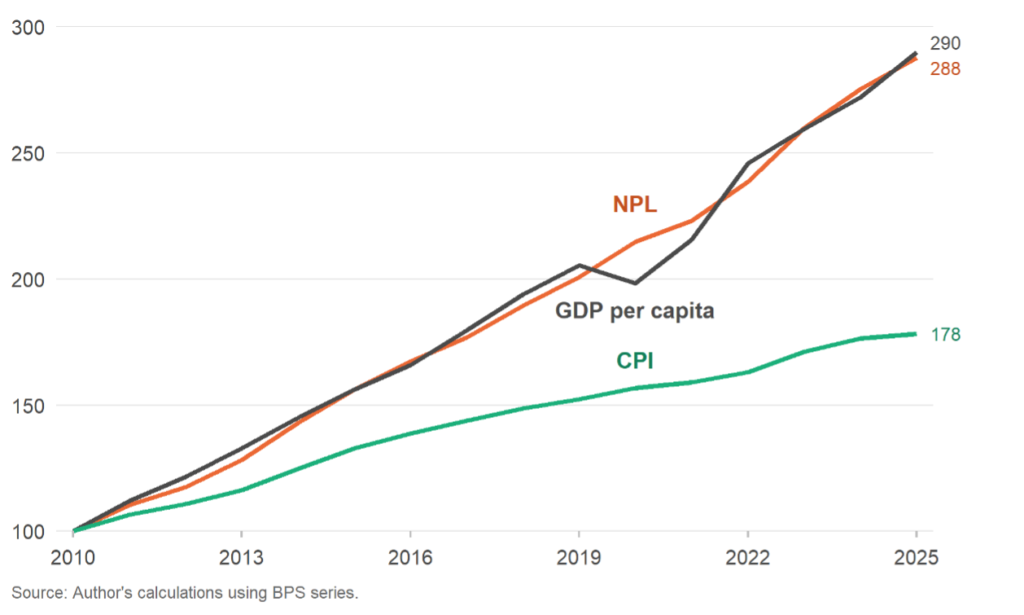
The combined effect of these two factors means that between 2010 and 2025, instead of behaving like a cost-of-living index, the NPL tracked another variable entirely: GDP per capita.
Figure 2: The NPL, GDP per capita, and the CPI (2010 = 100)
The choice to tie the middle-class threshold to the NPL means that the size of the middle class is determined by a race between middle-income Indonesians’ consumption expenditure in lane one and a balap bakiak team made up of GDP per capita, the NPL, and the middle-class threshold in lane two. When lane one wins, the middle class grows; when lane two wins, the middle class shrinks.
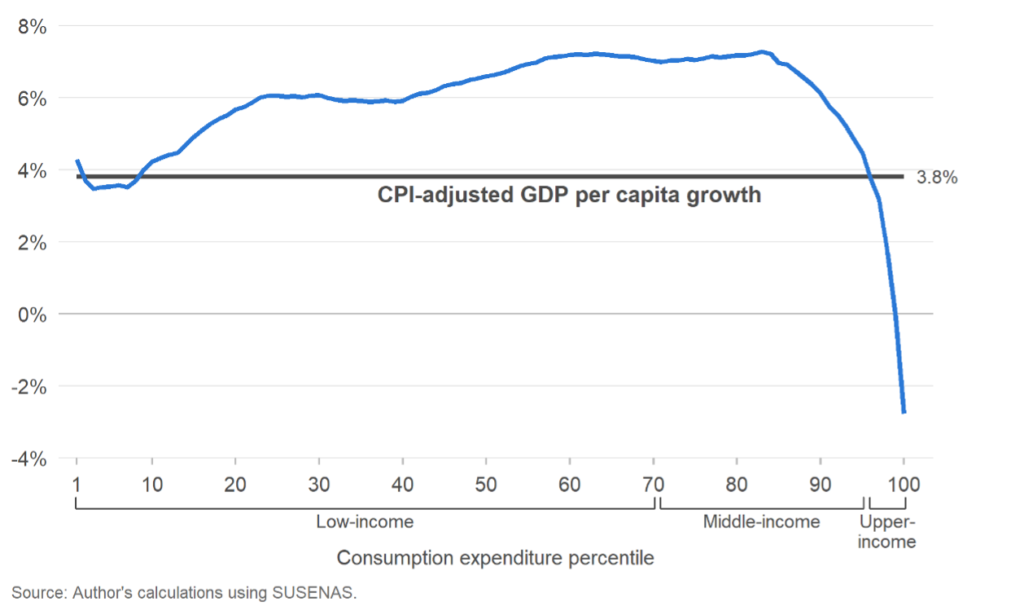
Between 2015 and 2018, lane one won, so the middle class grew from 43.4 million to 59.5 million.
Figure 3: Average annual CPI-adjusted consumption expenditure growth, March 2015–March 2018
Between 2018 and 2025, lane two won, so the middle class shrank from 59.5 million to 46.7 million.
Figure 4: Average annual CPI-adjusted consumption expenditure growth, March 2018–March 2025
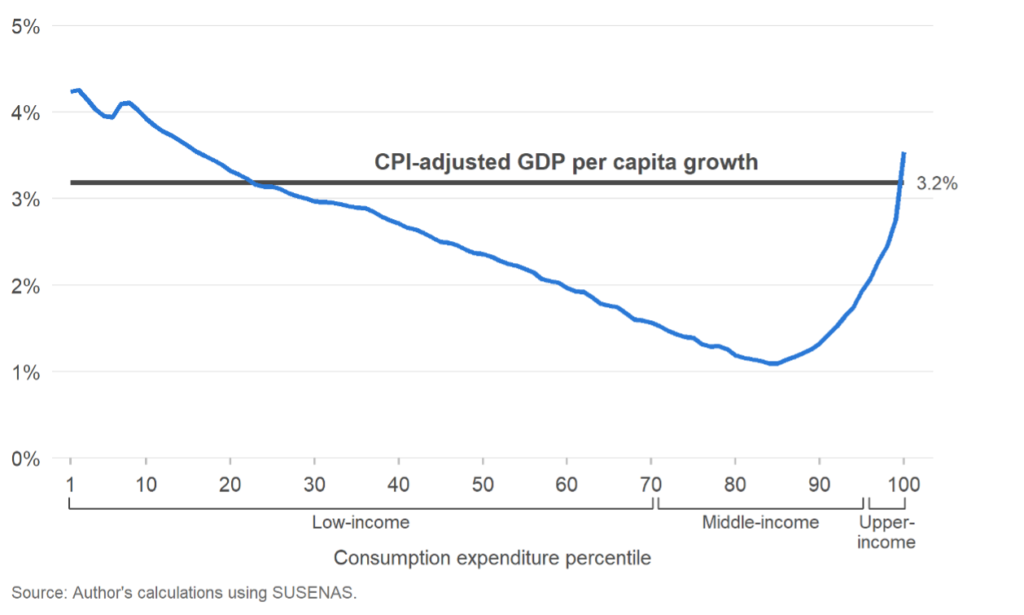
The 2019 World Bank report unintentionally established a perverse situation in which the middle class can shrink even when every percentile’s CPI-adjusted consumption expenditure is rising. In other words: the changing size of the middle class—as measured using the World Bank definition—does not tell us whether middle-income Indonesians are better or worse off.
This situation can be corrected by using the NPL only to set the middle-class threshold in some base year while in later and earlier years the threshold moves with the CPI. Take 2018 as the base year. There are 59.5 million people in the middle class. Tie the middle-class threshold (and the upper-class threshold) to the CPI and the middle class grows to 74.2 million by 2025.
It is worth addressing two objections to the suggestion that the middle-class threshold should be tied to the CPI rather than the NPL.
First, it could be argued that tying the middle-class threshold to the CPI would break the 2019 World Bank report’s carefully calibrated vulnerability to poverty approach: households with consumption expenditure greater than 3.5 times the NPL have a less than 10% chance of becoming poor or vulnerable in the following year.
The unravelling of community-driven development
“Murni top-down”: a look at Prabowo’s village cooperatives
Second, it could be argued that middle-income Indonesians spend a greater portion of their income on food than food’s share of the CPI basket. Given that food price inflation usually outruns general inflation, the CPI may understate the cost-of-living pressures experienced by middle-income Indonesians and therefore overstate the growth of the middle class.
This objection can be addressed using CPI sub-component price indexes. They enable the construction of distributional consumer price indexes (DCPIs) that account for each percentile’s greater or lesser share of spending on food and other high-inflation items.
Figure 5: Cumulative increase in the CPI, DCPIs, and the NPL, March 2015–March 2025
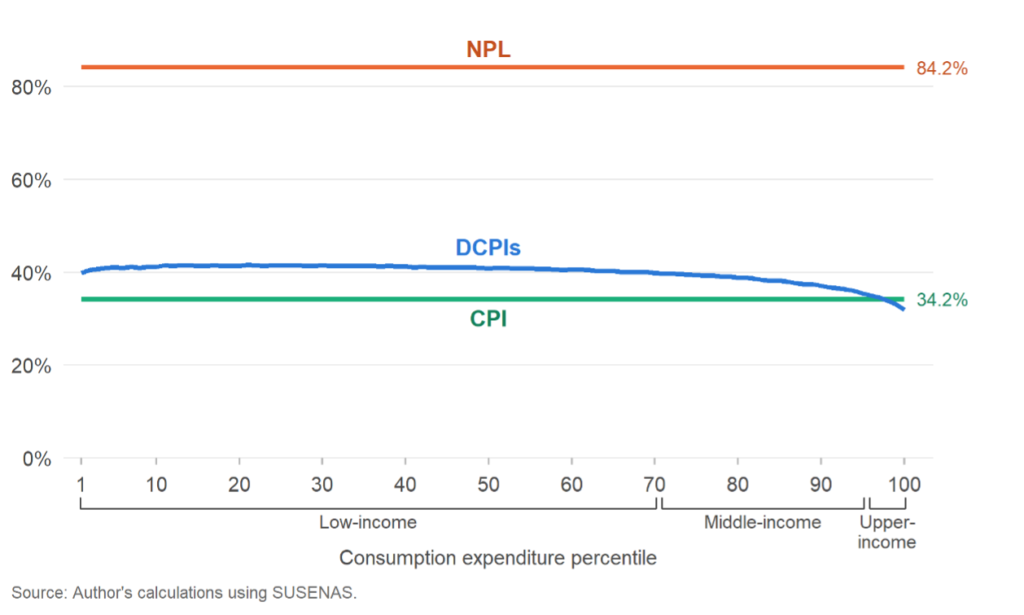
DCPIs confirm that middle-income Indonesians experience a higher level of inflation than is captured by the CPI. Nonetheless, this level is much better approximated by the CPI than the NPL. If the middle-class and upper-class thresholds are each tied to DCPIs measuring the level of inflation experienced by households near these thresholds, the middle class grows to 70.9 million by 2025. This means that middle-class purchasing power—defined in terms of the actual spending patterns of the middle class—rose between 2018 and 2025.
Figure 6: Middle class population, March 2015–March 2025
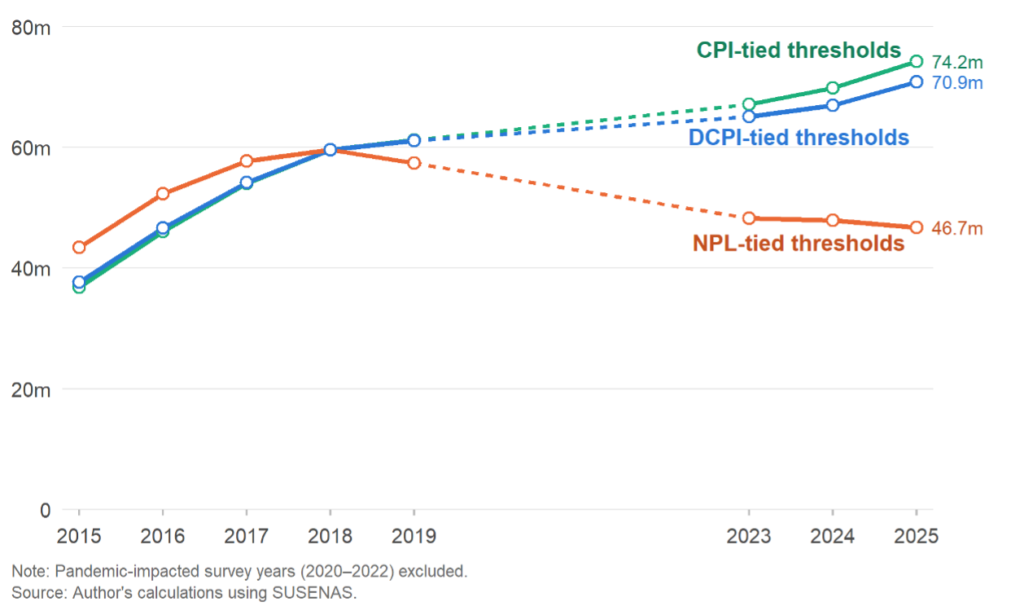
Of course, this result does not imply that the middle class is free from economic challenges. Middle-income Indonesians have experienced sluggish consumption expenditure growth since 2018, likely because of weak formal-sector job creation. But evidence-based commentary should avoid conflating middle-income Indonesians’ sluggish consumption expenditure growth with a real decline in their standards of living.
This point has implications for our understanding of Indonesian politics. If, as proponents of the shrinking middle class narrative claim, the middle class experienced a dramatic reversal of fortune between 2018 and 2025, then it becomes difficult to understand how Widodo was able to maintain such high approval ratings during his second term (2019–2024).
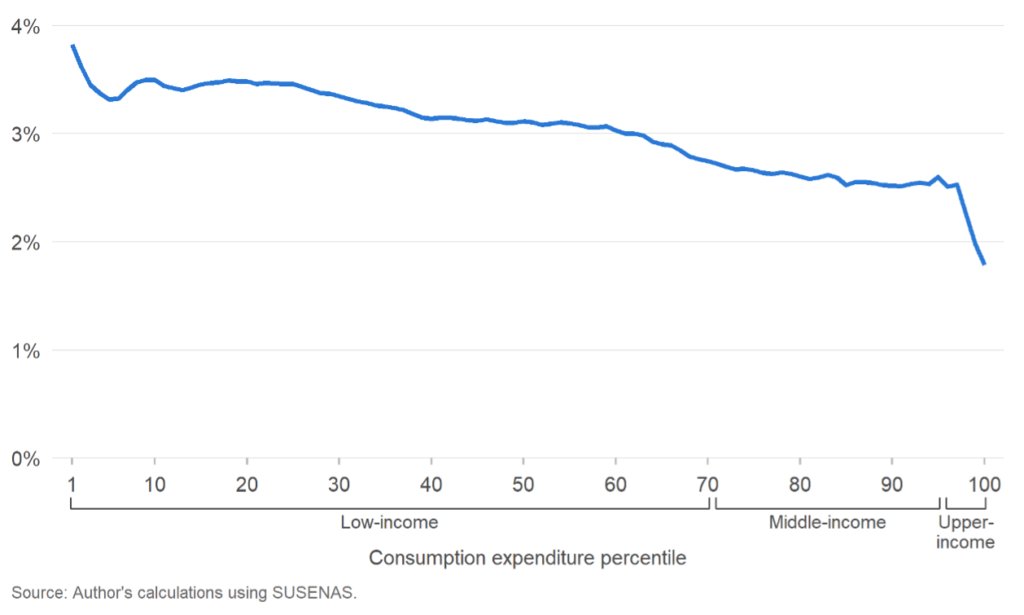
Once we stop allowing the NPL-based definition of middle-class status to dominate analysis, this mystery resolves itself. A CPI- or DCPI-based approach demonstrates that Widodo’s government oversaw sustained and relatively equitable real household consumption expenditure growth. There are many reasons to be critical of Widodo—his disregard for democratic norms, his nepotism, his failure to break Indonesia’s dependence on coal, and his weak performance on formal job creation—but his record on raising the population’s standard of living is not one of them.
Figure 7: Average annual DCPI-adjusted consumption expenditure growth, March 2015–March 2025
It remains to be seen whether Prabowo will be able to match the household consumption expenditure growth record of his predecessor. If evidence of proliferating economic mismanagement is anything to judge by, then it is unlikely that he will. Middle-income Indonesians may thus experience a real decline in their standards of living over the coming years.
The unravelling of community-driven development
“Murni top-down”: a look at Prabowo’s village cooperatives
If the middle-class threshold is instead tied to the CPI or DCPIs, then a real decline in middle-income Indonesians’ standards of living would appear as the reversal of a sustained middle class growth trend. The consequences of Prabowo’s economic mismanagement would be plain to see.
Appropriate statistical methodology is a necessary whetstone to keep political critique sharp.